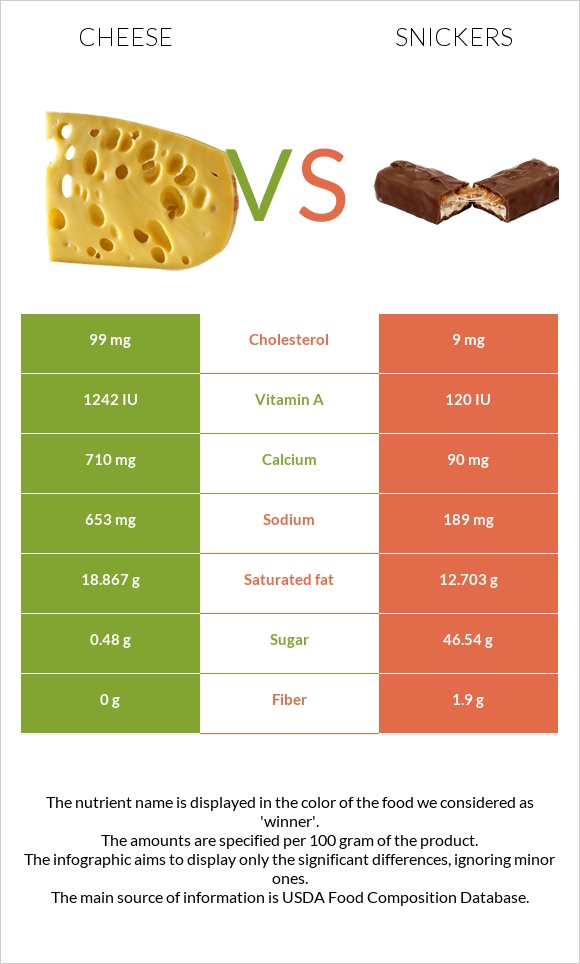
How are cheese and snickers different? Cheese has more calcium and vitamin A; however, snickers is richer in fiber and iron. Cheese covers your daily need for calcium, 62% more than snickers. Cheese has 11 times more cholesterol than snickers. Cheese has 99mg of cholesterol, while snickers has 9mg. Snickers has a higher glycemic index. The glycemic index of snickers is 51, while the glycemic index of cheese is 0. Cheese, cheddar and Candies, MARS SNACKFOOD US, SNICKERS CRUNCHER types were used in this article.
Infographic
Mineral Comparison
Mineral comparison score is based on the number of minerals by which one or the other food is richer. The "coverage" charts below show how much of the daily needs can be covered by 300 grams of the food.
8
100 g
300 g
1 cubic inch - 17g 1 slice (1 oz) - 28g 1 oz - 28.35g 1 cup, shredded - 113g 1 cup, diced - 132g 1 cup, melted - 244g
Magnesium
Magnesium
Calcium
Calcium
Potassium
Potassium
Iron
Iron
Copper
Copper
Zinc
Zinc
Phosphorus
Phosphorus
Sodium
Sodium
Manganese
Manganese
Selenium
Selenium
19%
213%
6.7%
5.3%
10%
99%
195%
85%
3.5%
155%
2
100 g
300 g
1 bar fun size - 15g 1 serving 1.56 oz bar - 44g 1 serving 1.66 oz bar - 47g
Magnesium
Magnesium
Calcium
Calcium
Potassium
Potassium
Iron
Iron
Copper
Copper
Zinc
Zinc
Phosphorus
Phosphorus
Sodium
Sodium
Manganese
Manganese
Selenium
Selenium
0%
27%
0%
26%
0%
0%
0%
25%
0%
0%
Vitamin Comparison
Vitamin comparison score is based on the number of vitamins by which one or the other food is richer. The "coverage" charts below show how much of the daily needs can be covered by 300 grams of the food.
11
100 g
300 g
1 cubic inch - 17g 1 slice (1 oz) - 28g 1 oz - 28.35g 1 cup, shredded - 113g 1 cup, diced - 132g 1 cup, melted - 244g
Vitamin C
Vit. C
Vitamin D
Vit. D
Vitamin A
Vit. A
Vitamin E
Vit. E
Vitamin B1
Vit. B1
Vitamin B2
Vit. B2
Vitamin B3
Vit. B3
Vitamin B5
Vit. B5
Vitamin B6
Vit. B6
Vitamin B12
Vit. B12
Vitamin K
Vit. K
Folate
Folate
0%
9%
110%
14%
7.3%
99%
1.1%
25%
15%
138%
6%
20%
1
100 g
300 g
1 bar fun size - 15g 1 serving 1.56 oz bar - 44g 1 serving 1.66 oz bar - 47g
Vitamin C
Vit. C
Vitamin D
Vit. D
Vitamin A
Vit. A
Vitamin E
Vit. E
Vitamin B1
Vit. B1
Vitamin B2
Vit. B2
Vitamin B3
Vit. B3
Vitamin B5
Vit. B5
Vitamin B6
Vit. B6
Vitamin B12
Vit. B12
Vitamin K
Vit. K
Folate
Folate
1.7%
0%
0%
0%
0%
0%
0%
0%
0%
0%
0%
0%
All nutrients comparison - raw data values
Nutrient
DV% diff.
Phosphorus
455mg
65%
Calcium
710mg
90mg
62%
Selenium
28.5µg
52%
Vitamin B12
1.1µg
46%
Vitamin A
330µg
37%
Zinc
3.64mg
33%
Vitamin B2
0.428mg
33%
Protein
22.87g
6.86g
32%
Cholesterol
99mg
9mg
30%
Saturated fat
18.867g
12.703g
28%
Monounsaturated fat
9.246g
23%
Carbs
3.09g
62.85g
20%
Sodium
653mg
189mg
20%
Fats
33.31g
24.38g
14%
Polyunsaturated fat
1.421g
9%
Fiber
0g
1.9g
8%
Vitamin B5
0.41mg
8%
Iron
0.14mg
0.68mg
7%
Folate
27µg
7%
Magnesium
27mg
6%
Vitamin E
0.71mg
5%
Vitamin B6
0.066mg
5%
Calories
404kcal
488kcal
4%
Vitamin D*
24 IU
3%
Vitamin D
0.6µg
3%
Copper
0.03mg
3%
Choline
16.5mg
3%
Potassium
76mg
2%
Vitamin B1
0.029mg
2%
Vitamin K
2.4µg
2%
Vitamin C
0mg
0.5mg
1%
Manganese
0.027mg
1%
Protein per 100 calories
5.7g
1.4g
N/A
Calories per 10 g protein
177kcal
711kcal
N/A
Weight per 100 calories
25g
20g
N/A
Unsaturated / Saturated Fat ratio
0.57
0
N/A
Net carbs
3.09g
60.95g
N/A
Sugar
0.48g
46.54g
N/A
Vitamin B3
0.059mg
0%
Trans fat
0.917g
0.394g
N/A
Tryptophan
0.547mg
0%
Threonine
1.044mg
0%
Isoleucine
1.206mg
0%
Leucine
1.939mg
0%
Lysine
1.025mg
0%
Methionine
0.547mg
0%
Phenylalanine
1.074mg
0%
Valine
1.404mg
0%
Histidine
0.547mg
0%
Omega-3 - EPA
0.01g
N/A
Omega-3 - DHA
0.001g
N/A
Omega-3 - DPA
0.017g
N/A
Omega-6 - Eicosadienoic acid
0.007g
N/A
Macronutrient Comparison
Macronutrient breakdown side-by-side comparison
4
23%
33%
3%
37%
4%
Protein:
22.87 g
Fats:
33.31 g
Carbs:
3.09 g
Water:
37.02 g
Other:
3.71 g
1
7%
24%
63%
4%
Protein:
6.86 g
Fats:
24.38 g
Carbs:
62.85 g
Water:
4.47 g
Other:
1.44 g
Contains
more
Protein Protein
+233.4%
Contains
more
Fats Fats
+36.6%
Contains
more
Water Water
+728.2%
Contains
more
Other Other
+157.6%
Contains
more
Carbs Carbs
+1934%
Fat Type Comparison
Fat type breakdown side-by-side comparison
2
64%
31%
5%
Saturated fat:
Sat. Fat
18.867 g
Monounsaturated fat:
Mono. Fat
9.246 g
Polyunsaturated fat:
Poly. Fat
1.421 g
1
100%
Saturated fat:
Sat. Fat
12.703 g
Monounsaturated fat:
Mono. Fat
0 g
Polyunsaturated fat:
Poly. Fat
0 g
Contains
more
Mono. Fat Monounsaturated fat
+∞%
Contains
more
Poly. Fat Polyunsaturated fat
+∞%
Contains
less
Sat. Fat Saturated fat
-32.7%