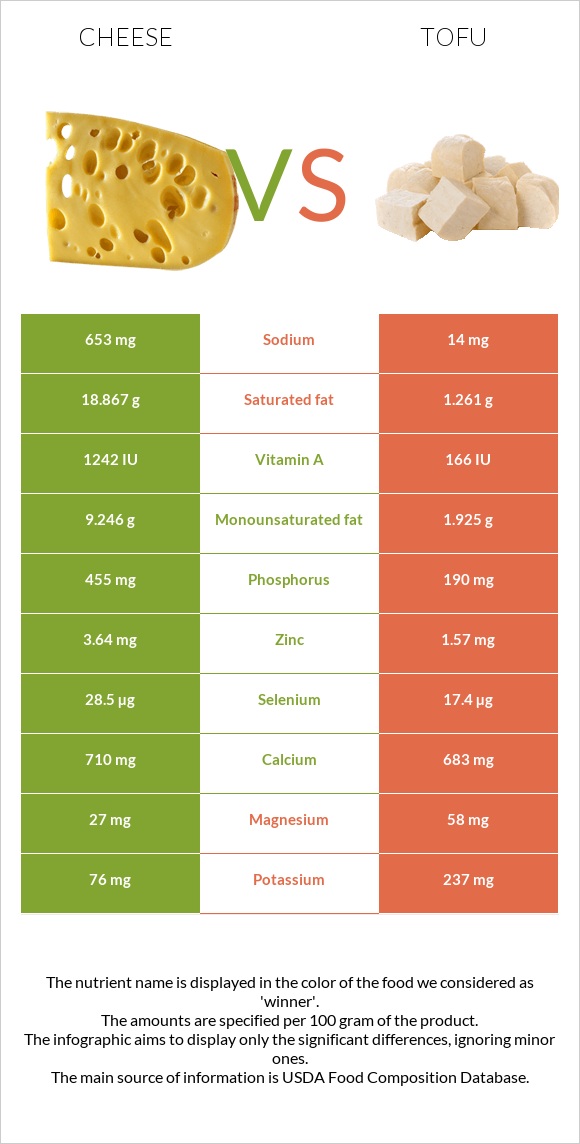
A recap on the differences between cheese and tofu Cheese is higher in vitamin B12, phosphorus, vitamin B2, and vitamin A, yet tofu is higher in manganese, copper, and iron. Cheese covers your daily saturated fat needs 88% more than tofu. The amount of cholesterol in tofu is lower. The glycemic index of cheese is lower. Food varieties used in this article are Cheese, cheddar and Tofu, raw, firm, prepared with calcium sulfate .
Infographic
Mineral Comparison
Mineral comparison score is based on the number of minerals by which one or the other food is richer. The "coverage" charts below show how much of the daily needs can be covered by 300 grams of the food.
3
100 g
300 g
1 cubic inch - 17g 1 slice (1 oz) - 28g 1 oz - 28.35g 1 cup, shredded - 113g 1 cup, diced - 132g 1 cup, melted - 244g
Magnesium
Magnesium
Calcium
Calcium
Potassium
Potassium
Iron
Iron
Copper
Copper
Zinc
Zinc
Phosphorus
Phosphorus
Sodium
Sodium
Manganese
Manganese
Selenium
Selenium
19%
213%
6.7%
5.3%
10%
99%
195%
85%
3.5%
155%
6
100 g
300 g
0.25 block - 81g 0.5 cup - 126g
Magnesium
Magnesium
Calcium
Calcium
Potassium
Potassium
Iron
Iron
Copper
Copper
Zinc
Zinc
Phosphorus
Phosphorus
Sodium
Sodium
Manganese
Manganese
Selenium
Selenium
41%
205%
21%
100%
126%
43%
81%
1.8%
154%
95%
Vitamin Comparison
Vitamin comparison score is based on the number of vitamins by which one or the other food is richer. The "coverage" charts below show how much of the daily needs can be covered by 300 grams of the food.
7
100 g
300 g
1 cubic inch - 17g 1 slice (1 oz) - 28g 1 oz - 28.35g 1 cup, shredded - 113g 1 cup, diced - 132g 1 cup, melted - 244g
Vitamin C
Vit. C
Vitamin D
Vit. D
Vitamin A
Vit. A
Vitamin E
Vit. E
Vitamin B1
Vit. B1
Vitamin B2
Vit. B2
Vitamin B3
Vit. B3
Vitamin B5
Vit. B5
Vitamin B6
Vit. B6
Vitamin B12
Vit. B12
Vitamin K
Vit. K
Folate
Folate
0%
9%
110%
14%
7.3%
99%
1.1%
25%
15%
138%
6%
20%
4
100 g
300 g
0.25 block - 81g 0.5 cup - 126g
Vitamin C
Vit. C
Vitamin D
Vit. D
Vitamin A
Vit. A
Vitamin E
Vit. E
Vitamin B1
Vit. B1
Vitamin B2
Vit. B2
Vitamin B3
Vit. B3
Vitamin B5
Vit. B5
Vitamin B6
Vit. B6
Vitamin B12
Vit. B12
Vitamin K
Vit. K
Folate
Folate
0.67%
0%
0%
0%
40%
24%
7.1%
8%
21%
0%
0%
22%
All nutrients comparison - raw data values
Nutrient
DV% diff.
Saturated fat
18.867g
1.261g
80%
Manganese
0.027mg
1.181mg
50%
Vitamin B12
1.1µg
0µg
46%
Copper
0.03mg
0.378mg
39%
Fats
33.31g
8.72g
38%
Phosphorus
455mg
190mg
38%
Vitamin A
330µg
37%
Cholesterol
99mg
0mg
33%
Iron
0.14mg
2.66mg
32%
Sodium
653mg
14mg
28%
Vitamin B2
0.428mg
0.102mg
25%
Polyunsaturated fat
1.421g
4.921g
23%
Selenium
28.5µg
17.4µg
20%
Zinc
3.64mg
1.57mg
19%
Monounsaturated fat
9.246g
1.925g
18%
Calories
404kcal
144kcal
13%
Protein
22.87g
17.27g
11%
Vitamin B1
0.029mg
0.158mg
11%
Fiber
0g
2.3g
9%
Magnesium
27mg
58mg
7%
Vitamin B5
0.41mg
0.133mg
6%
Potassium
76mg
237mg
5%
Vitamin E
0.71mg
5%
Vitamin D*
24 IU
0 IU
3%
Vitamin D
0.6µg
0µg
3%
Calcium
710mg
683mg
3%
Choline
16.5mg
3%
Vitamin B3
0.059mg
0.381mg
2%
Vitamin B6
0.066mg
0.092mg
2%
Vitamin K
2.4µg
2%
Folate
27µg
29µg
1%
Protein per 100 calories
5.7g
12g
N/A
Calories per 10 g protein
177kcal
83kcal
N/A
Weight per 100 calories
25g
69g
N/A
Unsaturated / Saturated Fat ratio
0.57
5.4
N/A
Vitamin C
0mg
0.2mg
0%
Net carbs
3.09g
0.48g
N/A
Carbs
3.09g
2.78g
0%
Sugar
0.48g
N/A
Trans fat
0.917g
0g
N/A
Tryptophan
0.547mg
0.235mg
0%
Threonine
1.044mg
0.785mg
0%
Isoleucine
1.206mg
0.849mg
0%
Leucine
1.939mg
1.392mg
0%
Lysine
1.025mg
0.883mg
0%
Methionine
0.547mg
0.211mg
0%
Phenylalanine
1.074mg
0.835mg
0%
Valine
1.404mg
0.87mg
0%
Histidine
0.547mg
0.431mg
0%
Omega-3 - EPA
0.01g
N/A
Omega-3 - DHA
0.001g
N/A
Omega-3 - DPA
0.017g
N/A
Omega-6 - Eicosadienoic acid
0.007g
N/A
Macronutrient Comparison
Macronutrient breakdown side-by-side comparison
4
23%
33%
3%
37%
4%
Protein:
22.87 g
Fats:
33.31 g
Carbs:
3.09 g
Water:
37.02 g
Other:
3.71 g
1
17%
9%
3%
70%
Protein:
17.27 g
Fats:
8.72 g
Carbs:
2.78 g
Water:
69.83 g
Other:
1.4 g
Contains
more
Protein Protein
+32.4%
Contains
more
Fats Fats
+282%
Contains
more
Other Other
+165%
Contains
more
Water Water
+88.6%
Fat Type Comparison
Fat type breakdown side-by-side comparison
1
64%
31%
5%
Saturated fat:
Sat. Fat
18.867 g
Monounsaturated fat:
Mono. Fat
9.246 g
Polyunsaturated fat:
Poly. Fat
1.421 g
2
16%
24%
61%
Saturated fat:
Sat. Fat
1.261 g
Monounsaturated fat:
Mono. Fat
1.925 g
Polyunsaturated fat:
Poly. Fat
4.921 g
Contains
more
Mono. Fat Monounsaturated fat
+380.3%
Contains
less
Sat. Fat Saturated fat
-93.3%
Contains
more
Poly. Fat Polyunsaturated fat
+246.3%