Chewing gum vs. Olive oil — In-Depth Nutrition Comparison
Compare
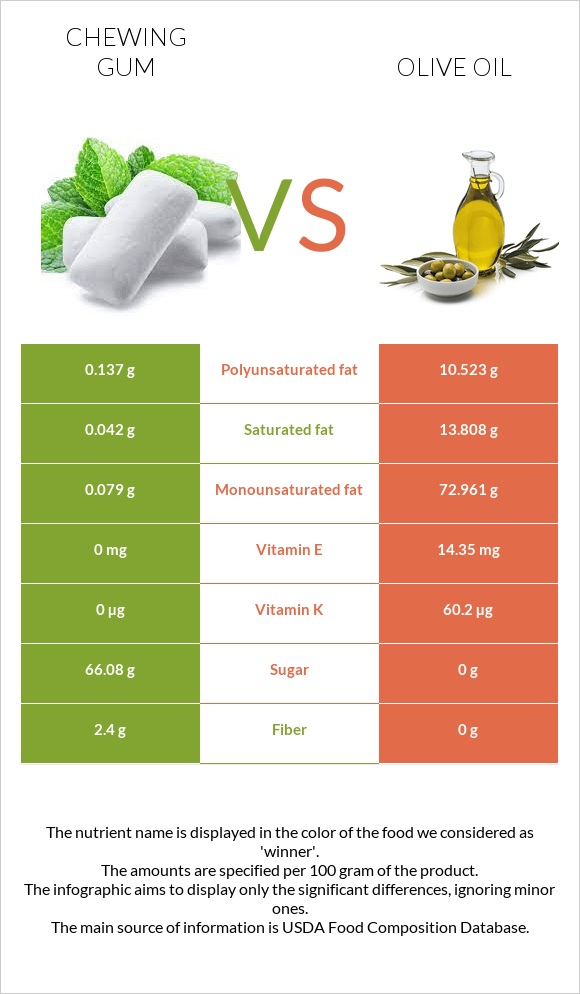
What are the main differences between chewing gum and olive oil?
- Chewing gum is richer in fiber, yet olive oil is richer in vitamin E, vitamin K, iron, monounsaturated fat, and polyunsaturated fat.
- Olive oil's daily need coverage for vitamin E is 96% higher.
- Olive oil contains less sugar.
We used Chewing gum and Oil, olive, salad or cooking types in this comparison.
Infographic
Infographic link
Mineral Comparison
Mineral comparison score is based on the number of minerals by which one or the other food is richer. The "coverage" charts below show how much of the daily needs can be covered by 300 grams of the food.
| Contains more PotassiumPotassium | +100% |
| Contains less SodiumSodium | -50% |
| Contains more SeleniumSelenium | +∞% |
| Contains more CalciumCalcium | +∞% |
| Contains more IronIron | +∞% |
Vitamin Comparison
Vitamin comparison score is based on the number of vitamins by which one or the other food is richer. The "coverage" charts below show how much of the daily needs can be covered by 300 grams of the food.
| Contains more Vitamin EVitamin E | +∞% |
| Contains more Vitamin KVitamin K | +∞% |
All nutrients comparison - raw data values
| Nutrient |  |
 |
DV% diff. |
| Monounsaturated fat | 0.079g | 72.961g | 182% |
| Fats | 0.3g | 100g | 153% |
| Vitamin E | 0mg | 14.35mg | 96% |
| Polyunsaturated fat | 0.137g | 10.523g | 69% |
| Saturated fat | 0.042g | 13.808g | 63% |
| Vitamin K | 0µg | 60.2µg | 50% |
| Carbs | 96.7g | 0g | 32% |
| Calories | 360kcal | 884kcal | 26% |
| Fiber | 2.4g | 0g | 10% |
| Iron | 0mg | 0.56mg | 7% |
| Selenium | 0.6µg | 0µg | 1% |
| Net carbs | 94.3g | 0g | N/A |
| Calcium | 0mg | 1mg | 0% |
| Potassium | 2mg | 1mg | 0% |
| Sugar | 66.08g | 0g | N/A |
| Sodium | 1mg | 2mg | 0% |
| Choline | 0mg | 0.3mg | 0% |
Macronutrient Comparison
Macronutrient breakdown side-by-side comparison
Protein:
0 g
Fats:
0.3 g
Carbs:
96.7 g
Water:
2.6 g
Other:
0.4 g
Protein:
0 g
Fats:
100 g
Carbs:
0 g
Water:
0 g
Other:
0 g
| Contains more CarbsCarbs | +∞% |
| Contains more WaterWater | +∞% |
| Contains more OtherOther | +∞% |
| Contains more FatsFats | +33233.3% |
~equal in
Protein
~0g
Fat Type Comparison
Fat type breakdown side-by-side comparison
Saturated fat:
Sat. Fat
0.042 g
Monounsaturated fat:
Mono. Fat
0.079 g
Polyunsaturated fat:
Poly. Fat
0.137 g
Saturated fat:
Sat. Fat
13.808 g
Monounsaturated fat:
Mono. Fat
72.961 g
Polyunsaturated fat:
Poly. Fat
10.523 g
| Contains less Sat. FatSaturated fat | -99.7% |
| Contains more Mono. FatMonounsaturated fat | +92255.7% |
| Contains more Poly. FatPolyunsaturated fat | +7581% |


