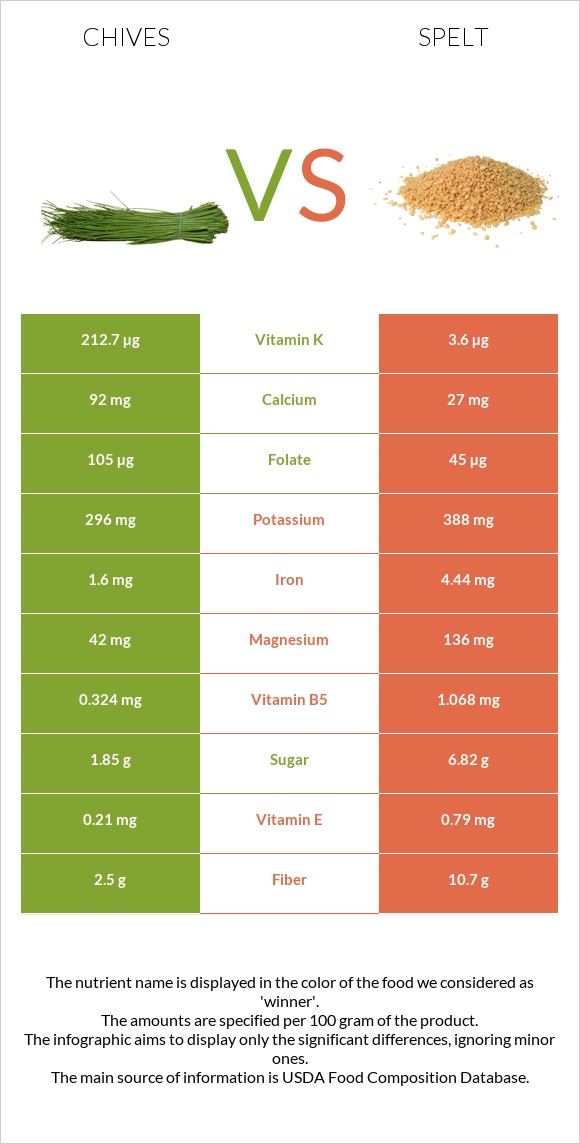
What are the differences between chives and spelt? Chives are higher in vitamin A, vitamin C, folate, calcium, and vitamin B2, yet spelt is higher in manganese, phosphorus, vitamin B3, copper, and zinc. Chives' daily need coverage for vitamin A is 87% more. The glycemic index of chives is lower. We used Chives, raw and Spelt, cooked types in this article.
Infographic
Mineral Comparison
Mineral comparison score is based on the number of minerals by which one or the other food is richer. The "coverage" charts below show how much of the daily needs can be covered by 300 grams of the food.
3
100 g
300 g
1 tsp chopped - 1g 1 tbsp chopped - 3g
Magnesium
Magnesium
Calcium
Calcium
Potassium
Potassium
Iron
Iron
Copper
Copper
Zinc
Zinc
Phosphorus
Phosphorus
Sodium
Sodium
Manganese
Manganese
Selenium
Selenium
30%
28%
26%
60%
52%
15%
25%
0.39%
49%
4.9%
6
100 g
300 g
1 cup - 194g
Magnesium
Magnesium
Calcium
Calcium
Potassium
Potassium
Iron
Iron
Copper
Copper
Zinc
Zinc
Phosphorus
Phosphorus
Sodium
Sodium
Manganese
Manganese
Selenium
Selenium
35%
3%
13%
63%
72%
34%
64%
0.65%
142%
22%
Vitamin Comparison
Vitamin comparison score is based on the number of vitamins by which one or the other food is richer. The "coverage" charts below show how much of the daily needs can be covered by 300 grams of the food.
7
100 g
300 g
1 tsp chopped - 1g 1 tbsp chopped - 3g
Vitamin C
Vit. C
Vitamin D
Vit. D
Vitamin A
Vit. A
Vitamin E
Vit. E
Vitamin B1
Vit. B1
Vitamin B2
Vit. B2
Vitamin B3
Vit. B3
Vitamin B5
Vit. B5
Vitamin B6
Vit. B6
Vitamin B12
Vit. B12
Vitamin K
Vit. K
Folate
Folate
194%
0%
73%
4.2%
20%
27%
12%
19%
32%
0%
532%
79%
3
100 g
300 g
1 cup - 194g
Vitamin C
Vit. C
Vitamin D
Vit. D
Vitamin A
Vit. A
Vitamin E
Vit. E
Vitamin B1
Vit. B1
Vitamin B2
Vit. B2
Vitamin B3
Vit. B3
Vitamin B5
Vit. B5
Vitamin B6
Vit. B6
Vitamin B12
Vit. B12
Vitamin K
Vit. K
Folate
Folate
0%
0%
0%
5.2%
26%
6.9%
48%
0%
18%
0%
0%
9.8%
All nutrients comparison - raw data values
Nutrient
DV% diff.
Vitamin K
212.7µg
177%
Vitamin C
58.1mg
0mg
65%
Manganese
0.373mg
1.091mg
31%
Vitamin A
218µg
0µg
24%
Folate
105µg
13µg
23%
Phosphorus
58mg
150mg
13%
Vitamin B3
0.647mg
2.57mg
12%
Calcium
92mg
10mg
8%
Starch
19.57g
8%
Carbs
4.35g
26.44g
7%
Vitamin B2
0.115mg
0.03mg
7%
Fiber
2.5g
3.9g
6%
Copper
0.157mg
0.215mg
6%
Zinc
0.56mg
1.25mg
6%
Selenium
0.9µg
4µg
6%
Vitamin B5
0.324mg
6%
Calories
30kcal
127kcal
5%
Potassium
296mg
143mg
5%
Protein
3.27g
5.5g
4%
Vitamin B6
0.138mg
0.08mg
4%
Magnesium
42mg
49mg
2%
Vitamin B1
0.078mg
0.103mg
2%
Polyunsaturated fat
0.267g
2%
Iron
1.6mg
1.67mg
1%
Choline
5.2mg
1%
Saturated fat
0.146g
1%
Protein per 100 calories
11g
4.3g
N/A
Calories per 10 g protein
92kcal
231kcal
N/A
Weight per 100 calories
333g
79g
N/A
Fats
0.73g
0.85g
0%
Net carbs
1.85g
22.54g
N/A
Sugar
1.85g
N/A
Sodium
3mg
5mg
0%
Vitamin E
0.21mg
0.26mg
0%
Monounsaturated fat
0.095g
0%
Tryptophan
0.037mg
0%
Threonine
0.128mg
0%
Isoleucine
0.139mg
0%
Leucine
0.195mg
0%
Lysine
0.163mg
0%
Methionine
0.036mg
0%
Phenylalanine
0.105mg
0%
Valine
0.145mg
0%
Histidine
0.057mg
0%
Macronutrient Comparison
Macronutrient breakdown side-by-side comparison
2
3%
4%
91%
Protein:
3.27 g
Fats:
0.73 g
Carbs:
4.35 g
Water:
90.65 g
Other:
1 g
3
6%
26%
67%
Protein:
5.5 g
Fats:
0.85 g
Carbs:
26.44 g
Water:
66.56 g
Other:
0.65 g
Contains
more
Water Water
+36.2%
Contains
more
Other Other
+53.8%
Contains
more
Protein Protein
+68.2%
Contains
more
Fats Fats
+16.4%
Contains
more
Carbs Carbs
+507.8%