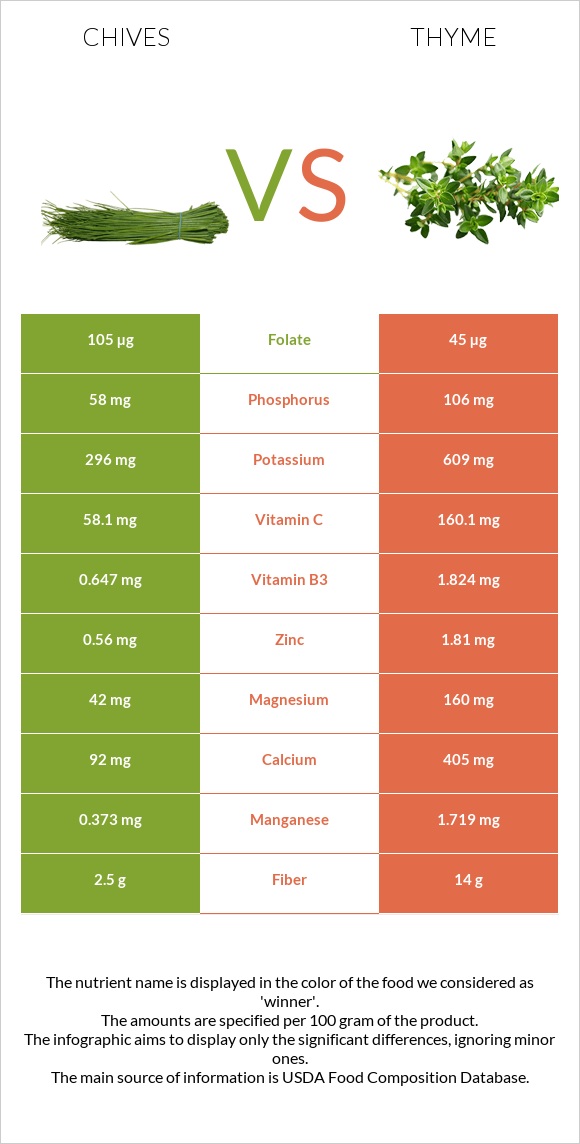
A recap on the differences between chives and thyme Chives are higher in folate, yet thyme is higher in iron, vitamin C, manganese, fiber, copper, calcium, magnesium, vitamin B2, and vitamin B6. Thyme covers your daily iron needs 198% more than chives. Chives contain 2 times more folate than thyme. While chives contain 105µg of folate, thyme contains only 45µg. Food varieties used in this article are Chives, raw and Thyme, fresh .
Infographic
Mineral Comparison
Mineral comparison score is based on the number of minerals by which one or the other food is richer. The "coverage" charts below show how much of the daily needs can be covered by 300 grams of the food.
2
100 g
300 g
1 tsp chopped - 1g 1 tbsp chopped - 3g
Magnesium
Magnesium
Calcium
Calcium
Potassium
Potassium
Iron
Iron
Copper
Copper
Zinc
Zinc
Phosphorus
Phosphorus
Sodium
Sodium
Manganese
Manganese
Selenium
Selenium
30%
28%
26%
60%
52%
15%
25%
0.39%
49%
4.9%
8
100 g
300 g
0.5 tsp - 0.4g 1 tsp - 0.8g
Magnesium
Magnesium
Calcium
Calcium
Potassium
Potassium
Iron
Iron
Copper
Copper
Zinc
Zinc
Phosphorus
Phosphorus
Sodium
Sodium
Manganese
Manganese
Selenium
Selenium
114%
122%
54%
654%
185%
49%
45%
1.2%
224%
0%
Vitamin Comparison
Vitamin comparison score is based on the number of vitamins by which one or the other food is richer. The "coverage" charts below show how much of the daily needs can be covered by 300 grams of the food.
4
100 g
300 g
1 tsp chopped - 1g 1 tbsp chopped - 3g
Vitamin C
Vit. C
Vitamin D
Vit. D
Vitamin A
Vit. A
Vitamin E
Vit. E
Vitamin B1
Vit. B1
Vitamin B2
Vit. B2
Vitamin B3
Vit. B3
Vitamin B5
Vit. B5
Vitamin B6
Vit. B6
Vitamin B12
Vit. B12
Vitamin K
Vit. K
Folate
Folate
194%
0%
73%
4.2%
20%
27%
12%
19%
32%
0%
532%
79%
5
100 g
300 g
0.5 tsp - 0.4g 1 tsp - 0.8g
Vitamin C
Vit. C
Vitamin D
Vit. D
Vitamin A
Vit. A
Vitamin E
Vit. E
Vitamin B1
Vit. B1
Vitamin B2
Vit. B2
Vitamin B3
Vit. B3
Vitamin B5
Vit. B5
Vitamin B6
Vit. B6
Vitamin B12
Vit. B12
Vitamin K
Vit. K
Folate
Folate
534%
0%
79%
0%
12%
109%
34%
25%
80%
0%
0%
34%
All nutrients comparison - raw data values
Nutrient
DV% diff.
Iron
1.6mg
17.45mg
198%
Vitamin K
212.7µg
177%
Vitamin C
58.1mg
160.1mg
113%
Manganese
0.373mg
1.719mg
59%
Fiber
2.5g
14g
46%
Copper
0.157mg
0.555mg
44%
Calcium
92mg
405mg
31%
Magnesium
42mg
160mg
28%
Vitamin B2
0.115mg
0.471mg
27%
Vitamin B6
0.138mg
0.348mg
16%
Folate
105µg
45µg
15%
Zinc
0.56mg
1.81mg
11%
Potassium
296mg
609mg
9%
Carbs
4.35g
24.45g
7%
Phosphorus
58mg
106mg
7%
Vitamin B3
0.647mg
1.824mg
7%
Protein
3.27g
5.56g
5%
Calories
30kcal
101kcal
4%
Vitamin B1
0.078mg
0.048mg
3%
Vitamin A
218µg
238µg
2%
Selenium
0.9µg
2%
Vitamin B5
0.324mg
0.409mg
2%
Polyunsaturated fat
0.267g
0.532g
2%
Fats
0.73g
1.68g
1%
Vitamin E
0.21mg
1%
Choline
5.2mg
1%
Saturated fat
0.146g
0.467g
1%
Protein per 100 calories
11g
5.5g
N/A
Calories per 10 g protein
92kcal
182kcal
N/A
Weight per 100 calories
333g
99g
N/A
Net carbs
1.85g
10.45g
N/A
Sugar
1.85g
N/A
Sodium
3mg
9mg
0%
Monounsaturated fat
0.095g
0.081g
0%
Tryptophan
0.037mg
0.114mg
0%
Threonine
0.128mg
0.154mg
0%
Isoleucine
0.139mg
0.285mg
0%
Leucine
0.195mg
0.262mg
0%
Lysine
0.163mg
0.126mg
0%
Methionine
0.036mg
0%
Phenylalanine
0.105mg
0%
Valine
0.145mg
0.307mg
0%
Histidine
0.057mg
0%
Macronutrient Comparison
Macronutrient breakdown side-by-side comparison
1
3%
4%
91%
Protein:
3.27 g
Fats:
0.73 g
Carbs:
4.35 g
Water:
90.65 g
Other:
1 g
4
6%
2%
24%
65%
3%
Protein:
5.56 g
Fats:
1.68 g
Carbs:
24.45 g
Water:
65.11 g
Other:
3.2 g
Contains
more
Water Water
+39.2%
Contains
more
Protein Protein
+70%
Contains
more
Fats Fats
+130.1%
Contains
more
Carbs Carbs
+462.1%
Contains
more
Other Other
+220%
Fat Type Comparison
Fat type breakdown side-by-side comparison
2
29%
19%
53%
Saturated fat:
Sat. Fat
0.146 g
Monounsaturated fat:
Mono. Fat
0.095 g
Polyunsaturated fat:
Poly. Fat
0.267 g
1
43%
8%
49%
Saturated fat:
Sat. Fat
0.467 g
Monounsaturated fat:
Mono. Fat
0.081 g
Polyunsaturated fat:
Poly. Fat
0.532 g
Contains
less
Sat. Fat Saturated fat
-68.7%
Contains
more
Mono. Fat Monounsaturated fat
+17.3%
Contains
more
Poly. Fat Polyunsaturated fat
+99.3%