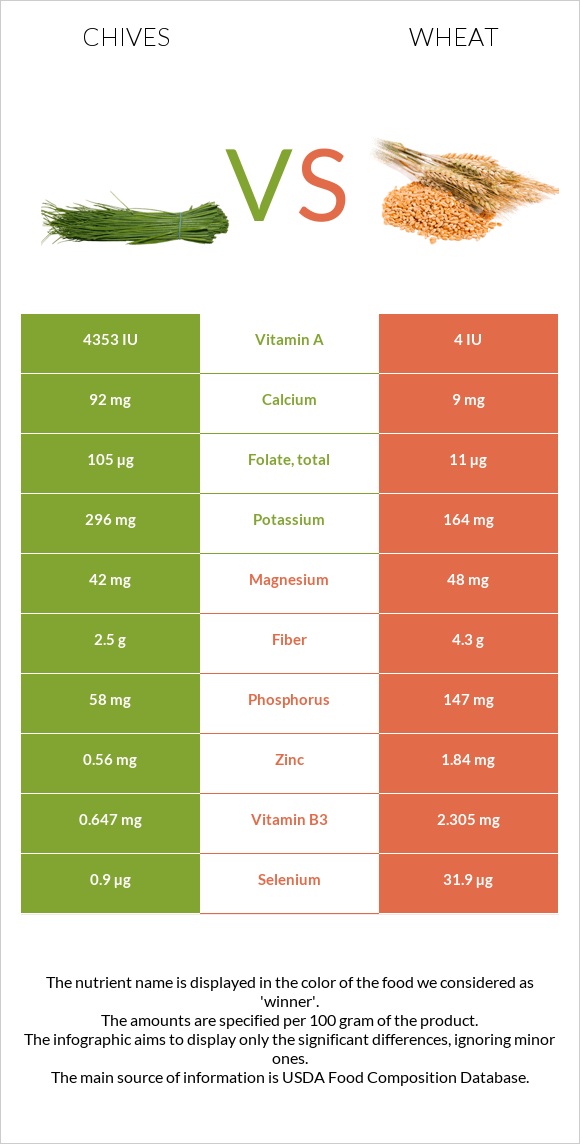
A recap on the differences between chives and wheat Chives are higher in vitamin A, folate, calcium, and vitamin B2, yet wheat is higher in selenium, manganese, phosphorus, zinc, vitamin B3, and fiber. Chives cover your daily vitamin A needs 87% more than wheat. Chives contain 10 times more calcium than wheat. While chives contain 92mg of calcium, wheat contains only 9mg. Food varieties used in this article are Chives, raw and Wheat, KAMUT khorasan, cooked .
Infographic
Mineral Comparison
Mineral comparison score is based on the number of minerals by which one or the other food is richer. The "coverage" charts below show how much of the daily needs can be covered by 300 grams of the food.
3
100 g
300 g
1 tsp chopped - 1g 1 tbsp chopped - 3g
Magnesium
Magnesium
Calcium
Calcium
Potassium
Potassium
Iron
Iron
Copper
Copper
Zinc
Zinc
Phosphorus
Phosphorus
Sodium
Sodium
Manganese
Manganese
Selenium
Selenium
30%
28%
26%
60%
52%
15%
25%
0.39%
49%
4.9%
6
100 g
300 g
1 cup - 172g
Magnesium
Magnesium
Calcium
Calcium
Potassium
Potassium
Iron
Iron
Copper
Copper
Zinc
Zinc
Phosphorus
Phosphorus
Sodium
Sodium
Manganese
Manganese
Selenium
Selenium
34%
2.7%
14%
66%
69%
50%
63%
1%
134%
174%
Vitamin Comparison
Vitamin comparison score is based on the number of vitamins by which one or the other food is richer. The "coverage" charts below show how much of the daily needs can be covered by 300 grams of the food.
7
100 g
300 g
1 tsp chopped - 1g 1 tbsp chopped - 3g
Vitamin C
Vit. C
Vitamin D
Vit. D
Vitamin A
Vit. A
Vitamin E
Vit. E
Vitamin B1
Vit. B1
Vitamin B2
Vit. B2
Vitamin B3
Vit. B3
Vitamin B5
Vit. B5
Vitamin B6
Vit. B6
Vitamin B12
Vit. B12
Vitamin K
Vit. K
Folate
Folate
194%
0%
73%
4.2%
20%
27%
12%
19%
32%
0%
532%
79%
3
100 g
300 g
1 cup - 172g
Vitamin C
Vit. C
Vitamin D
Vit. D
Vitamin A
Vit. A
Vitamin E
Vit. E
Vitamin B1
Vit. B1
Vitamin B2
Vit. B2
Vitamin B3
Vit. B3
Vitamin B5
Vit. B5
Vitamin B6
Vit. B6
Vitamin B12
Vit. B12
Vitamin K
Vit. K
Folate
Folate
0%
0%
0%
4.8%
24%
6.9%
43%
0%
16%
0%
0%
8.3%
All nutrients comparison - raw data values
Nutrient
DV% diff.
Vitamin K
212.7µg
177%
Vitamin C
58.1mg
65%
Selenium
0.9µg
31.9µg
56%
Manganese
0.373mg
1.03mg
29%
Vitamin A
218µg
24%
Folate
105µg
11µg
24%
Phosphorus
58mg
147mg
13%
Zinc
0.56mg
1.84mg
12%
Vitamin B3
0.647mg
2.305mg
10%
Carbs
4.35g
27.6g
8%
Calcium
92mg
9mg
8%
Fiber
2.5g
4.3g
7%
Vitamin B2
0.115mg
0.03mg
7%
Copper
0.157mg
0.207mg
6%
Vitamin B5
0.324mg
6%
Calories
30kcal
132kcal
5%
Protein
3.27g
5.71g
5%
Vitamin B6
0.138mg
0.07mg
5%
Potassium
296mg
164mg
4%
Iron
1.6mg
1.76mg
2%
Magnesium
42mg
48mg
1%
Vitamin B1
0.078mg
0.095mg
1%
Choline
5.2mg
1%
Protein per 100 calories
11g
4.3g
N/A
Calories per 10 g protein
92kcal
231kcal
N/A
Weight per 100 calories
333g
76g
N/A
Fats
0.73g
0.83g
0%
Net carbs
1.85g
23.3g
N/A
Sugar
1.85g
3.07g
N/A
Sodium
3mg
8mg
0%
Vitamin E
0.21mg
0.24mg
0%
Trans fat
0g
0.002g
N/A
Saturated fat
0.146g
0.077g
0%
Monounsaturated fat
0.095g
0.084g
0%
Polyunsaturated fat
0.267g
0.243g
0%
Tryptophan
0.037mg
0.051mg
0%
Threonine
0.128mg
0.172mg
0%
Isoleucine
0.139mg
0.22mg
0%
Leucine
0.195mg
0.432mg
0%
Lysine
0.163mg
0.161mg
0%
Methionine
0.036mg
0.097mg
0%
Phenylalanine
0.105mg
0.3mg
0%
Valine
0.145mg
0.267mg
0%
Histidine
0.057mg
0.147mg
0%
Macronutrient Comparison
Macronutrient breakdown side-by-side comparison
2
3%
4%
91%
Protein:
3.27 g
Fats:
0.73 g
Carbs:
4.35 g
Water:
90.65 g
Other:
1 g
3
6%
28%
65%
Protein:
5.71 g
Fats:
0.83 g
Carbs:
27.6 g
Water:
65.18 g
Other:
0.68 g
Contains
more
Water Water
+39.1%
Contains
more
Other Other
+47.1%
Contains
more
Protein Protein
+74.6%
Contains
more
Fats Fats
+13.7%
Contains
more
Carbs Carbs
+534.5%
Fat Type Comparison
Fat type breakdown side-by-side comparison
2
29%
19%
53%
Saturated fat:
Sat. Fat
0.146 g
Monounsaturated fat:
Mono. Fat
0.095 g
Polyunsaturated fat:
Poly. Fat
0.267 g
1
19%
21%
60%
Saturated fat:
Sat. Fat
0.077 g
Monounsaturated fat:
Mono. Fat
0.084 g
Polyunsaturated fat:
Poly. Fat
0.243 g
Contains
more
Mono. Fat Monounsaturated fat
+13.1%
Contains
less
Sat. Fat Saturated fat
-47.3%
~equal in
Polyunsaturated fat
~0.243g