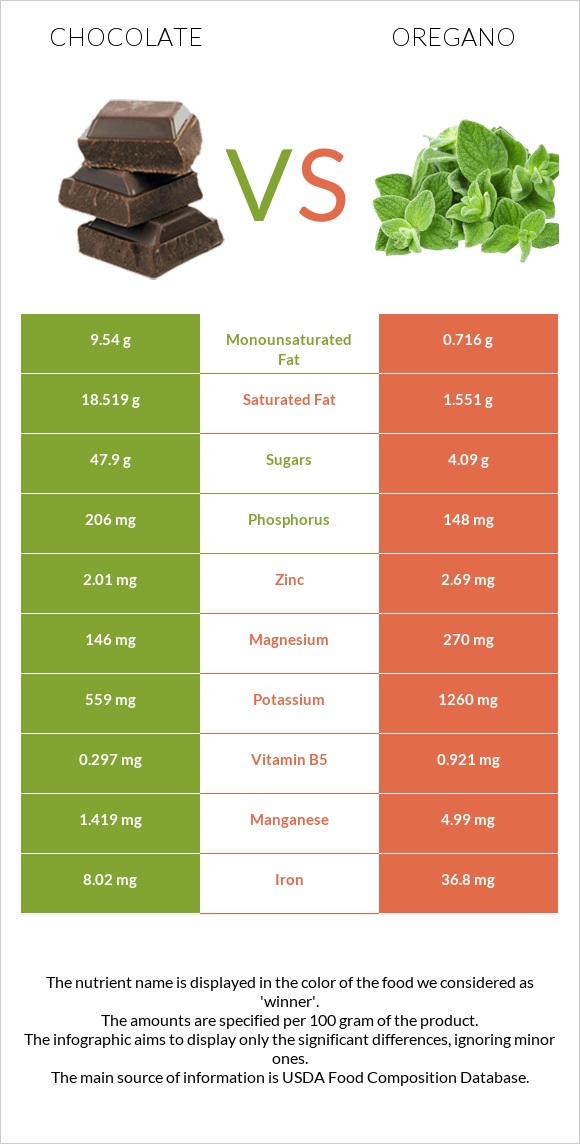
How are chocolate and oregano different? Chocolate is higher in copper; however, oregano is richer in vitamin K, iron, manganese, calcium, fiber, vitamin E, vitamin B6, and vitamin B2. Daily need coverage for vitamin K for oregano is 511% higher. Chocolate contains 12 times more saturated fat than oregano. While chocolate contains 18.519g of saturated fat, oregano contains only 1.551g. Oregano has a lower glycemic index (5) than chocolate (23). Chocolate, dark, 45- 59% cacao solids and Spices, oregano, dried are the varieties used in this article.
Infographic
Mineral Comparison
Mineral comparison score is based on the number of minerals by which one or the other food is richer. The "coverage" charts below show how much of the daily needs can be covered by 300 grams of the food.
2
100 g
300 g
1 oz - 28.35g 1 bar - 162g
Magnesium
Magnesium
Calcium
Calcium
Potassium
Potassium
Iron
Iron
Copper
Copper
Zinc
Zinc
Phosphorus
Phosphorus
Sodium
Sodium
Manganese
Manganese
Selenium
Selenium
104%
17%
49%
301%
343%
55%
88%
3.1%
185%
16%
7
100 g
300 g
0.25 tsp - 0.5g 1 tsp, ground - 1.8g
Magnesium
Magnesium
Calcium
Calcium
Potassium
Potassium
Iron
Iron
Copper
Copper
Zinc
Zinc
Phosphorus
Phosphorus
Sodium
Sodium
Manganese
Manganese
Selenium
Selenium
193%
479%
111%
1380%
211%
73%
63%
3.3%
651%
25%
Vitamin Comparison
Vitamin comparison score is based on the number of vitamins by which one or the other food is richer. The "coverage" charts below show how much of the daily needs can be covered by 300 grams of the food.
1
100 g
300 g
1 oz - 28.35g 1 bar - 162g
Vitamin C
Vit. C
Vitamin D
Vit. D
Vitamin A
Vit. A
Vitamin E
Vit. E
Vitamin B1
Vit. B1
Vitamin B2
Vit. B2
Vitamin B3
Vit. B3
Vitamin B5
Vit. B5
Vitamin B6
Vit. B6
Vitamin B12
Vit. B12
Vitamin K
Vit. K
Folate
Folate
0%
0%
0.67%
11%
6.3%
12%
14%
18%
9.7%
29%
20%
0%
10
100 g
300 g
0.25 tsp - 0.5g 1 tsp, ground - 1.8g
Vitamin C
Vit. C
Vitamin D
Vit. D
Vitamin A
Vit. A
Vitamin E
Vit. E
Vitamin B1
Vit. B1
Vitamin B2
Vit. B2
Vitamin B3
Vit. B3
Vitamin B5
Vit. B5
Vitamin B6
Vit. B6
Vitamin B12
Vit. B12
Vitamin K
Vit. K
Folate
Folate
7.7%
0%
28%
365%
44%
122%
87%
55%
241%
0%
1554%
178%
All nutrients comparison - raw data values
Nutrient
DV% diff.
Vitamin K
8.1µg
621.7µg
511%
Iron
8.02mg
36.8mg
360%
Manganese
1.419mg
4.99mg
155%
Calcium
56mg
1597mg
154%
Fiber
7g
42.5g
142%
Vitamin E
0.54mg
18.26mg
118%
Vitamin B6
0.042mg
1.044mg
77%
Saturated fat
18.519g
1.551g
77%
Folate
237µg
59%
Copper
1.028mg
0.633mg
44%
Fats
31.28g
4.28g
42%
Vitamin B2
0.05mg
0.528mg
37%
Magnesium
146mg
270mg
30%
Vitamin B3
0.725mg
4.64mg
24%
Monounsaturated fat
9.54g
0.716g
22%
Potassium
559mg
1260mg
21%
Calories
546kcal
265kcal
14%
Vitamin B1
0.025mg
0.177mg
13%
Vitamin B5
0.297mg
0.921mg
12%
Caffeine
43mg
0mg
11%
Vitamin B12
0.23µg
0µg
10%
Vitamin A
2µg
85µg
9%
Protein
4.88g
9g
8%
Phosphorus
206mg
148mg
8%
Zinc
2.01mg
2.69mg
6%
Choline
32.3mg
6%
Vitamin C
2.3mg
3%
Carbs
61.17g
68.92g
3%
Cholesterol
8mg
0mg
3%
Selenium
3µg
4.5µg
3%
Polyunsaturated fat
1.092g
1.369g
2%
Fructose
0g
1.13g
1%
Protein per 100 calories
0.89g
3.4g
N/A
Calories per 10 g protein
1119kcal
294kcal
N/A
Weight per 100 calories
18g
38g
N/A
Unsaturated / Saturated Fat ratio
0.57
1.3
N/A
Net carbs
54.17g
26.42g
N/A
Sugar
47.9g
4.09g
N/A
Sodium
24mg
25mg
0%
Trans fat
0.112g
0g
N/A
Tryptophan
0.203mg
0%
Threonine
0.322mg
0%
Isoleucine
0.441mg
0%
Leucine
0.78mg
0%
Lysine
0.5mg
0%
Methionine
0.127mg
0%
Phenylalanine
0.449mg
0%
Valine
0.585mg
0%
Histidine
0.144mg
0%
Omega-3 - EPA
0.001g
0g
N/A
Omega-3 - ALA
0.085g
0.621g
N/A
Omega-6 - Eicosadienoic acid
0.001g
0g
N/A
Omega-6 - Linoleic acid
0.947g
N/A
Macronutrient Comparison
Macronutrient breakdown side-by-side comparison
1
5%
31%
61%
2%
Protein:
4.88 g
Fats:
31.28 g
Carbs:
61.17 g
Water:
0.97 g
Other:
1.7 g
4
9%
4%
69%
10%
8%
Protein:
9 g
Fats:
4.28 g
Carbs:
68.92 g
Water:
9.93 g
Other:
7.87 g
Contains
more
Fats Fats
+630.8%
Contains
more
Protein Protein
+84.4%
Contains
more
Carbs Carbs
+12.7%
Contains
more
Water Water
+923.7%
Contains
more
Other Other
+362.9%
Fat Type Comparison
Fat type breakdown side-by-side comparison
1
64%
33%
4%
Saturated fat:
Sat. Fat
18.519 g
Monounsaturated fat:
Mono. Fat
9.54 g
Polyunsaturated fat:
Poly. Fat
1.092 g
2
43%
20%
38%
Saturated fat:
Sat. Fat
1.551 g
Monounsaturated fat:
Mono. Fat
0.716 g
Polyunsaturated fat:
Poly. Fat
1.369 g
Contains
more
Mono. Fat Monounsaturated fat
+1232.4%
Contains
less
Sat. Fat Saturated fat
-91.6%
Contains
more
Poly. Fat Polyunsaturated fat
+25.4%
Carbohydrate type comparison
Carbohydrate type breakdown side-by-side comparison
2
97%
3%
Starch:
0 g
Sucrose:
46.25 g
Glucose:
0 g
Fructose:
0 g
Lactose:
1.65 g
Maltose:
0 g
Galactose:
0 g
3
22%
46%
28%
4%
Starch:
0 g
Sucrose:
0.91 g
Glucose:
1.9 g
Fructose:
1.13 g
Lactose:
0 g
Maltose:
0 g
Galactose:
0.15 g
Contains
more
Sucrose Sucrose
+4982.4%
Contains
more
Lactose Lactose
+∞%
Contains
more
Glucose Glucose
+∞%
Contains
more
Fructose Fructose
+∞%
Contains
more
Galactose Galactose
+∞%
~equal in
Starch
~0g
~equal in
Maltose
~0g