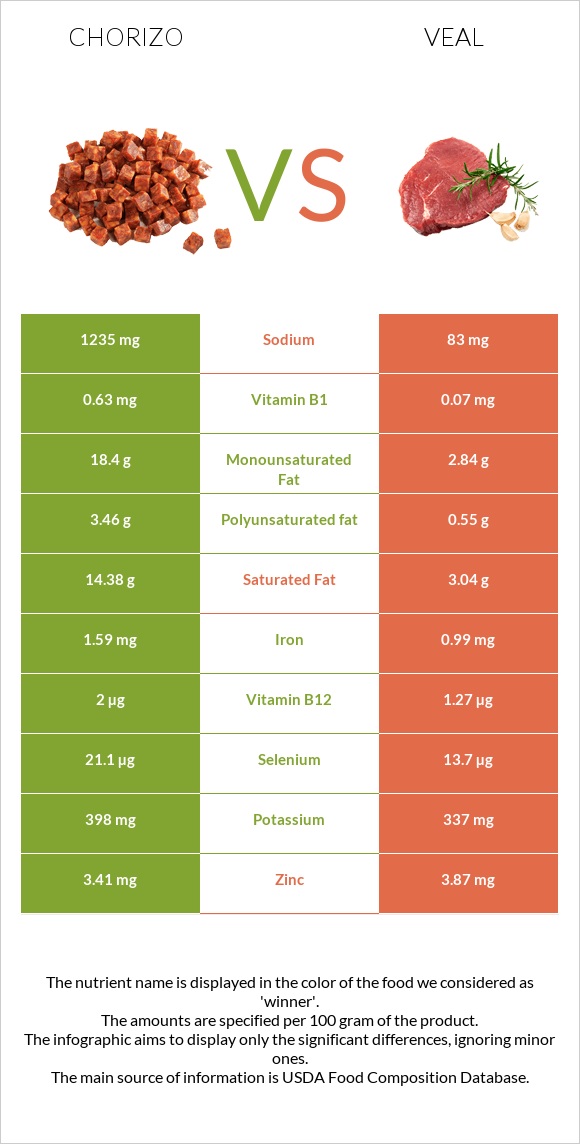
Important differences between chorizo and veal Chorizo has more vitamin B1, vitamin B12, selenium, vitamin B6, vitamin D* and iron; however, veal has more vitamin B3 and phosphorus. Chorizo's daily need coverage for saturated fat is 57% more. Veal is lower in sodium. Chorizo has a higher glycemic index than veal. The food varieties used in the comparison are Chorizo, pork, and beef and Veal, ground, cooked, broiled .
Infographic
Mineral Comparison
Mineral comparison score is based on the number of minerals by which one or the other food is richer. The "coverage" charts below show how much of the daily needs can be covered by 300 grams of the food.
4
100 g
300 g
1 oz - 28.35g 1 link (4" long) - 60g
Magnesium
Magnesium
Calcium
Calcium
Potassium
Potassium
Iron
Iron
Copper
Copper
Zinc
Zinc
Phosphorus
Phosphorus
Sodium
Sodium
Manganese
Manganese
Selenium
Selenium
13%
2.4%
35%
60%
27%
93%
64%
161%
5.2%
115%
6
100 g
300 g
3 oz - 85g 1 unit, cooked (yield from 1 lb raw meat) - 299g
Magnesium
Magnesium
Calcium
Calcium
Potassium
Potassium
Iron
Iron
Copper
Copper
Zinc
Zinc
Phosphorus
Phosphorus
Sodium
Sodium
Manganese
Manganese
Selenium
Selenium
17%
5.1%
30%
37%
34%
106%
93%
11%
4.6%
75%
Vitamin Comparison
Vitamin comparison score is based on the number of vitamins by which one or the other food is richer. The "coverage" charts below show how much of the daily needs can be covered by 300 grams of the food.
6
100 g
300 g
1 oz - 28.35g 1 link (4" long) - 60g
Vitamin C
Vit. C
Vitamin D
Vit. D
Vitamin A
Vit. A
Vitamin E
Vit. E
Vitamin B1
Vit. B1
Vitamin B2
Vit. B2
Vitamin B3
Vit. B3
Vitamin B5
Vit. B5
Vitamin B6
Vit. B6
Vitamin B12
Vit. B12
Vitamin K
Vit. K
Folate
Folate
0%
23%
0%
4.4%
158%
69%
96%
67%
122%
250%
4%
1.5%
2
100 g
300 g
3 oz - 85g 1 unit, cooked (yield from 1 lb raw meat) - 299g
Vitamin C
Vit. C
Vitamin D
Vit. D
Vitamin A
Vit. A
Vitamin E
Vit. E
Vitamin B1
Vit. B1
Vitamin B2
Vit. B2
Vitamin B3
Vit. B3
Vitamin B5
Vit. B5
Vitamin B6
Vit. B6
Vitamin B12
Vit. B12
Vitamin K
Vit. K
Folate
Folate
0%
0%
0%
3%
18%
62%
151%
70%
90%
159%
3%
8.3%
All nutrients comparison - raw data values
Nutrient
DV% diff.
Saturated fat
14.38g
3.04g
52%
Sodium
1235mg
83mg
50%
Fats
38.27g
7.56g
47%
Vitamin B1
0.63mg
0.07mg
47%
Monounsaturated fat
18.4g
2.84g
39%
Vitamin B12
2µg
1.27µg
30%
Polyunsaturated fat
3.46g
0.55g
19%
Vitamin B3
5.131mg
8.03mg
18%
Calories
455kcal
172kcal
14%
Selenium
21.1µg
13.7µg
13%
Vitamin B6
0.53mg
0.39mg
11%
Phosphorus
150mg
217mg
10%
Vitamin D*
61 IU
0 IU
8%
Vitamin D
1.5µg
0µg
8%
Iron
1.59mg
0.99mg
8%
Cholesterol
88mg
103mg
5%
Zinc
3.41mg
3.87mg
4%
Copper
0.08mg
0.103mg
3%
Potassium
398mg
337mg
2%
Vitamin B2
0.3mg
0.27mg
2%
Folate
2µg
11µg
2%
Protein
24.1g
24.38g
1%
Carbs
1.86g
0g
1%
Magnesium
18mg
24mg
1%
Calcium
8mg
17mg
1%
Vitamin B5
1.12mg
1.16mg
1%
Protein per 100 calories
5.3g
14g
N/A
Calories per 10 g protein
189kcal
71kcal
N/A
Weight per 100 calories
22g
58g
N/A
Unsaturated / Saturated Fat ratio
1.5
1.1
N/A
Net carbs
1.86g
0g
N/A
Vitamin E
0.22mg
0.15mg
0%
Manganese
0.04mg
0.035mg
0%
Vitamin K
1.6µg
1.2µg
0%
Choline
96.7mg
95mg
0%
Tryptophan
0.278mg
0.247mg
0%
Threonine
1.473mg
1.065mg
0%
Isoleucine
2.206mg
1.201mg
0%
Leucine
1.708mg
1.94mg
0%
Lysine
2.414mg
2.009mg
0%
Methionine
0.47mg
0.569mg
0%
Phenylalanine
1.149mg
0.984mg
0%
Valine
0.914mg
1.347mg
0%
Histidine
0.721mg
0.885mg
0%
Macronutrient Comparison
Macronutrient breakdown side-by-side comparison
3
24%
38%
2%
32%
4%
Protein:
24.1 g
Fats:
38.27 g
Carbs:
1.86 g
Water:
31.85 g
Other:
3.92 g
2
24%
8%
67%
Protein:
24.38 g
Fats:
7.56 g
Carbs:
0 g
Water:
66.76 g
Other:
1.3 g
Contains
more
Fats Fats
+406.2%
Contains
more
Carbs Carbs
+∞%
Contains
more
Other Other
+201.5%
Contains
more
Water Water
+109.6%
~equal in
Protein
~24.38g
Fat Type Comparison
Fat type breakdown side-by-side comparison
2
40%
51%
10%
Saturated fat:
Sat. Fat
14.38 g
Monounsaturated fat:
Mono. Fat
18.4 g
Polyunsaturated fat:
Poly. Fat
3.46 g
1
47%
44%
9%
Saturated fat:
Sat. Fat
3.04 g
Monounsaturated fat:
Mono. Fat
2.84 g
Polyunsaturated fat:
Poly. Fat
0.55 g
Contains
more
Mono. Fat Monounsaturated fat
+547.9%
Contains
more
Poly. Fat Polyunsaturated fat
+529.1%
Contains
less
Sat. Fat Saturated fat
-78.9%