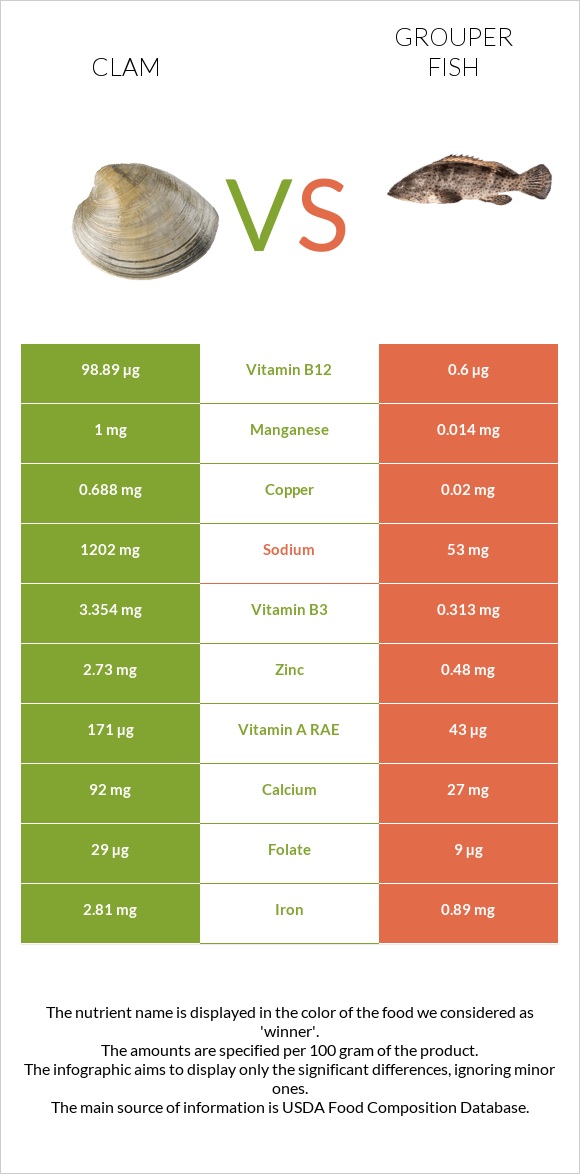
Differences between clam and grouper Grouper contains less vitamin B12, copper, manganese, vitamin B2, selenium, phosphorus, vitamin C, iron, and zinc than clam. Clam's daily need coverage for vitamin B12 is 4092% higher. The amount of sodium in grouper is lower. Grouper has a lower glycemic index. The glycemic index of grouper is 0, while the glycemic index of clam is 27. The food types used in this comparison are Mollusks, clam, mixed species, cooked, moist heat and Fish, grouper, mixed species, cooked, dry heat .
Infographic
Mineral Comparison
Mineral comparison score is based on the number of minerals by which one or the other food is richer. The "coverage" charts below show how much of the daily needs can be covered by 300 grams of the food.
8
100 g
300 g
3 oz - 85g 20 small - 190g
Magnesium
Magnesium
Calcium
Calcium
Potassium
Potassium
Iron
Iron
Copper
Copper
Zinc
Zinc
Phosphorus
Phosphorus
Sodium
Sodium
Manganese
Manganese
Selenium
Selenium
13%
28%
55%
105%
229%
74%
145%
157%
130%
349%
2
100 g
300 g
3 oz - 85g 1 fillet - 202g
Magnesium
Magnesium
Calcium
Calcium
Potassium
Potassium
Iron
Iron
Copper
Copper
Zinc
Zinc
Phosphorus
Phosphorus
Sodium
Sodium
Manganese
Manganese
Selenium
Selenium
26%
6.3%
42%
43%
15%
14%
61%
6.9%
1.6%
255%
Vitamin Comparison
Vitamin comparison score is based on the number of vitamins by which one or the other food is richer. The "coverage" charts below show how much of the daily needs can be covered by 300 grams of the food.
7
100 g
300 g
3 oz - 85g 20 small - 190g
Vitamin C
Vit. C
Vitamin D
Vit. D
Vitamin A
Vit. A
Vitamin E
Vit. E
Vitamin B1
Vit. B1
Vitamin B2
Vit. B2
Vitamin B3
Vit. B3
Vitamin B5
Vit. B5
Vitamin B6
Vit. B6
Vitamin B12
Vit. B12
Vitamin K
Vit. K
Folate
Folate
74%
0%
57%
0%
38%
98%
63%
41%
25%
12361%
0%
22%
2
100 g
300 g
3 oz - 85g 1 fillet - 202g
Vitamin C
Vit. C
Vitamin D
Vit. D
Vitamin A
Vit. A
Vitamin E
Vit. E
Vitamin B1
Vit. B1
Vitamin B2
Vit. B2
Vitamin B3
Vit. B3
Vitamin B5
Vit. B5
Vitamin B6
Vit. B6
Vitamin B12
Vit. B12
Vitamin K
Vit. K
Folate
Folate
0%
0%
17%
0%
20%
1.4%
7.1%
52%
81%
86%
0%
7.5%
All nutrients comparison - raw data values
Nutrient
DV% diff.
Vitamin B12
98.89µg
0.69µg
4092%
Copper
0.688mg
0.045mg
71%
Sodium
1202mg
53mg
50%
Manganese
1mg
0.012mg
43%
Vitamin B2
0.426mg
0.006mg
32%
Selenium
64µg
46.8µg
31%
Phosphorus
338mg
143mg
28%
Vitamin C
22.1mg
0mg
25%
Iron
2.81mg
1.14mg
21%
Zinc
2.73mg
0.51mg
20%
Vitamin B3
3.354mg
0.381mg
19%
Vitamin B6
0.11mg
0.35mg
18%
Vitamin A
171µg
50µg
13%
Cholesterol
67mg
47mg
7%
Calcium
92mg
21mg
7%
Vitamin B1
0.15mg
0.081mg
6%
Magnesium
18mg
37mg
5%
Potassium
628mg
475mg
5%
Folate
29µg
10µg
5%
Vitamin B5
0.68mg
0.87mg
4%
Calories
148kcal
118kcal
2%
Carbs
5.13g
0g
2%
Protein
25.55g
24.84g
1%
Fats
1.95g
1.3g
1%
Saturated fat
0.188g
0.299g
1%
Polyunsaturated fat
0.552g
0.403g
1%
Protein per 100 calories
17g
21g
N/A
Calories per 10 g protein
58kcal
48kcal
N/A
Weight per 100 calories
68g
85g
N/A
Net carbs
5.13g
0g
N/A
Monounsaturated fat
0.172g
0.268g
0%
Tryptophan
0.286mg
0.278mg
0%
Threonine
1.099mg
1.089mg
0%
Isoleucine
1.112mg
1.145mg
0%
Leucine
1.798mg
2.019mg
0%
Lysine
1.909mg
2.282mg
0%
Methionine
0.576mg
0.735mg
0%
Phenylalanine
0.915mg
0.97mg
0%
Valine
1.116mg
1.28mg
0%
Histidine
0.49mg
0.731mg
0%
Omega-3 - EPA
0.138g
0.035g
N/A
Omega-3 - DHA
0.146g
0.213g
N/A
Omega-3 - DPA
0.104g
0.017g
N/A
Macronutrient Comparison
Macronutrient breakdown side-by-side comparison
4
26%
2%
5%
64%
4%
Protein:
25.55 g
Fats:
1.95 g
Carbs:
5.13 g
Water:
63.64 g
Other:
3.73 g
1
25%
73%
Protein:
24.84 g
Fats:
1.3 g
Carbs:
0 g
Water:
73.36 g
Other:
0.5 g
Contains
more
Fats Fats
+50%
Contains
more
Carbs Carbs
+∞%
Contains
more
Other Other
+646%
Contains
more
Water Water
+15.3%
~equal in
Protein
~24.84g
Fat Type Comparison
Fat type breakdown side-by-side comparison
2
21%
19%
61%
Saturated fat:
Sat. Fat
0.188 g
Monounsaturated fat:
Mono. Fat
0.172 g
Polyunsaturated fat:
Poly. Fat
0.552 g
1
31%
28%
42%
Saturated fat:
Sat. Fat
0.299 g
Monounsaturated fat:
Mono. Fat
0.268 g
Polyunsaturated fat:
Poly. Fat
0.403 g
Contains
less
Sat. Fat Saturated fat
-37.1%
Contains
more
Poly. Fat Polyunsaturated fat
+37%
Contains
more
Mono. Fat Monounsaturated fat
+55.8%