Clam vs. Scallops — Health Impact and Nutrition Comparison


Summary
Clams are richer in nutrients, being higher in protein, fats, such as omega-3 fatty acids, and, therefore, calories.
Clams are significantly better sources of vitamins, as they contain 100 times more vitamin A and 45 times more vitamin B12. Clams are also overall richer in most minerals.
Scallops, however, are lower in sodium and cholesterol.
Introduction
Clams and scallops are popular types of seafood that often get confused with each other. In this article, we will talk about their differences, as well as their similarities, mainly focusing on nutrition and health impact.
Classification and Appearance
Clams and scallops are both types of bivalve mollusks, meaning they have two shells that are hinged together. Mollusks are a type of shellfish. Clam and scallop are the common names, each including various species of these edible mollusks.
Scallops and clams can are found in both saltwater and freshwater environments. However, scallops are generally found in deeper waters than clams, and they tend to inhabit areas with sandy or muddy bottoms.
One of the main differences between scallops and clams is the size and shape of the shells. Clams tend to have round or oval shells that are generally smaller than scallops. Scallops have a flatter, more circular shells with distinctive scalloped edges, which give them their name.
Taste and Use
Another difference is the way the two animals move. Clams are stationary and burrow into the sand or mud to anchor themselves in place. Scallops, on the other hand, are able to move around by using their muscles to open and close their shells and "swimming" through the water. This leads to the difference in the development of the muscles, which partially accounts for the difference in taste and texture.
Clams are typically smaller and more chewy than scallops, and they have a salty, briny taste that is often described as "ocean-like." Scallops, however, are larger and more tender with a more subtle and sweet flavor.
The two types of mollusks are often used in different types of dishes. Clams are often used in soups, chowders, and pasta dishes, while scallops are often grilled, seared, and sautéed to be used in dishes such as scallop risotto or scallop ceviche or served raw as sushi or sashimi.
Nutrition
The nutritional information below is presented for mixed species of clam cooked with moist heat and bay and sea scallops cooked by steaming.
The average serving size per person for both clam and scallop is 3 ounces, equal to 85g.
Macronutrients and Calories
Clam is relatively denser in nutrients consisting of 64% water and 36% nutrients, while scallop is made up of 71% water and 29% nutrients.
Calories
Clam and scallops are both medium-calorie foods; however, clam provides more calories with 148kcal per 100g serving. The same serving of scallops contains 111 calories.
Protein
Like many shellfish, clams and scallops are excellent sources of protein.
Clam is richer in protein by about 5g per 100g serving. A 100g serving of clams covers 61% of the daily needed protein value by containing 25,5g.
The same 100g serving of scallops contains 20.5g protein and covers 49% of the daily needed protein value.
The protein found in these mollusks is of high quality, as it contains high levels of all essential amino acids. Naturally, the clam is richer in all these amino acids.
Fats
While both these foods are low in fats overall, clams contain over two times more fat. That being said, clam provides less than 2g of fats per 100g serving.
Clams also have a preferable fat profile than scallops containing mostly polyunsaturated fats, such as omega-3 fatty acids. However, scallops are lower in cholesterol, containing 41mg per 100g serving, while clams have 67mg of cholesterol in the same serving.
Carbohydrates
Clams and scallops are low-carbohydrate foods. They contain nearly the same amount of carbohydrates - about 5g per 100g serving. Clams are only a little lower in carbs than scallops.
The carbohydrate content of both clam and scallop consists entirely of net carbs as they don’t provide dietary fiber.
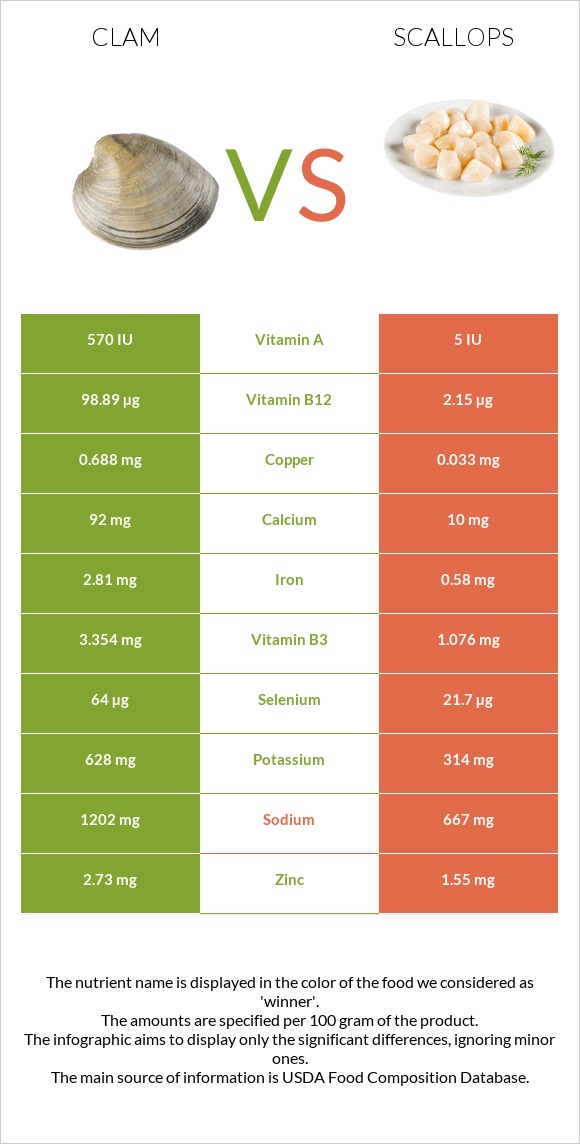
Vitamins
Clam is the ultimate winner in the vitamin category. Clam is over 100 times richer in vitamin A, about 45 times richer in vitamin B12, and 10 times richer in vitamins B1 and B2.
Clam falls in the top 12% of foods as a source of vitamin B12.
Clam is also a better source of vitamin C, vitamin B3, vitamin B5, and folate or vitamin B9.
Vitamin Comparison
Contains
more
Vitamin CVitamin C
+∞%
Contains
more
Vitamin AVitamin A
+8450%
Contains
more
Vitamin B1Vitamin B1
+1150%
Contains
more
Vitamin B2Vitamin B2
+1675%
Contains
more
Vitamin B3Vitamin B3
+211.7%
Contains
more
Vitamin B5Vitamin B5
+85.8%
Contains
more
Vitamin B12Vitamin B12
+4499.5%
Contains
more
FolateFolate
+45%
Minerals
Clams are relatively richer in minerals, as they are 20 times higher in copper, 9 times higher in calcium, and 4 times higher in iron. Clams are also richer in potassium and zinc.
Scallops, however, are a better source of magnesium and phosphorus. Scallops are lower in sodium.
Mineral Comparison
Contains
more
CalciumCalcium
+820%
Contains
more
PotassiumPotassium
+100%
Contains
more
IronIron
+384.5%
Contains
more
CopperCopper
+1984.8%
Contains
more
ZincZinc
+76.1%
Contains
more
ManganeseManganese
+3348.3%
Contains
more
SeleniumSelenium
+194.9%
Contains
more
MagnesiumMagnesium
+105.6%
Contains
more
PhosphorusPhosphorus
+26%
Contains
less
SodiumSodium
-44.5%
Health Impact
Scallops and clams are good sources of protein, which is essential for building and repairing tissues in the body. They are also high in iron, which is important for carrying oxygen to the cells in the body, and they are a good source of other essential nutrients such as zinc, copper, and selenium.
Cardiovascular Health
High-cholesterol diets are often said to lead to cardiovascular disease. Shellfish, such as clams and scallops, are relatively high in cholesterol; however, research has found no difference in the risk of adverse cardiovascular events in participants who were low, medium, and high shellfish consumers (1).
On the contrary, clam intake has been studied to have a protective effect on animal heart cells (2).
Lean seafood, such as scallops, has also been found to have a beneficial metabolic health effect compared to chicken, reducing blood cholesterol and serum glucose levels (3).
Diabetes
In experimental animal studies, scallop protein, high in taurine and glycine, prevents weight gain and high-sucrose-induced obesity, as well as improves plasma lipid profile (4).
A high intake of fatty seafood has been shown to increase circulating levels of the insulin-sensitizing hormone adiponectin. Compared with a high meat intake, high seafood intake may also decrease inflammatory biomarker levels (5).
However, some studies have found greater shellfish intake seems to be associated with an increased risk of diabetes (6). Thus, moderation may be advised.
Allergy
Shellfish and mollusk allergies are common food allergies. Symptoms of a shellfish allergy can range from mild to severe and may include skin rash, hives, swelling, difficulty breathing, nausea, vomiting, and anaphylaxis.
While some people can be allergic to only one type of shellfish, most have cross reactions to other types of shellfish as well. So if you are allergic to clams, you may also be allergic to scallops and the other way around.
Sources.

Infographic
All nutrients comparison - raw data values
| Nutrient | |
|
DV% diff. |
| Vitamin B12 | 98.89µg | 2.15µg | 4031% |
| Selenium | 64µg | 21.7µg | 77% |
| Copper | 0.688mg | 0.033mg | 73% |
| Manganese | 1mg | 0.029mg | 42% |
| Vitamin B2 | 0.426mg | 0.024mg | 31% |
| Iron | 2.81mg | 0.58mg | 28% |
| Vitamin C | 22.1mg | 0mg | 25% |
| Sodium | 1202mg | 667mg | 23% |
| Choline | 110.7mg | 20% | |
| Vitamin A | 171µg | 2µg | 19% |
| Vitamin B3 | 3.354mg | 1.076mg | 14% |
| Phosphorus | 338mg | 426mg | 13% |
| Vitamin B1 | 0.15mg | 0.012mg | 12% |
| Zinc | 2.73mg | 1.55mg | 11% |
| Protein | 25.55g | 20.54g | 10% |
| Cholesterol | 67mg | 41mg | 9% |
| Potassium | 628mg | 314mg | 9% |
| Calcium | 92mg | 10mg | 8% |
| Vitamin B5 | 0.68mg | 0.366mg | 6% |
| Magnesium | 18mg | 37mg | 5% |
| Calories | 148kcal | 111kcal | 2% |
| Fats | 1.95g | 0.84g | 2% |
| Starch | 3.69g | 2% | |
| Folate | 29µg | 20µg | 2% |
| Polyunsaturated fat | 0.552g | 0.222g | 2% |
| Protein per 100 calories | 17g | 19g | N/A |
| Calories per 10 g protein | 58kcal | 54kcal | N/A |
| Weight per 100 calories | 68g | 90g | N/A |
| Net carbs | 5.13g | 5.41g | N/A |
| Carbs | 5.13g | 5.41g | 0% |
| Vitamin D* | 2 IU | 0% | |
| Vitamin B6 | 0.11mg | 0.112mg | 0% |
| Trans fat | 0.009g | N/A | |
| Saturated fat | 0.188g | 0.218g | 0% |
| Monounsaturated fat | 0.172g | 0.082g | 0% |
| Tryptophan | 0.286mg | 0.173mg | 0% |
| Threonine | 1.099mg | 0.629mg | 0% |
| Isoleucine | 1.112mg | 0.692mg | 0% |
| Leucine | 1.798mg | 1.226mg | 0% |
| Lysine | 1.909mg | 1.258mg | 0% |
| Methionine | 0.576mg | 0.487mg | 0% |
| Phenylalanine | 0.915mg | 0.597mg | 0% |
| Valine | 1.116mg | 0.645mg | 0% |
| Histidine | 0.49mg | 0.314mg | 0% |
| Omega-3 - EPA | 0.138g | 0.072g | N/A |
| Omega-3 - DHA | 0.146g | 0.104g | N/A |
| Omega-3 - DPA | 0.104g | 0.005g | N/A |
| Omega-6 - Eicosadienoic acid | 0.002g | N/A |
Macronutrient Comparison
| Contains more ProteinProtein | +24.4% |
| Contains more FatsFats | +132.1% |
| Contains more OtherOther | +26% |
| Contains more WaterWater | +10.4% |
Fat Type Comparison
| Contains less Sat. FatSaturated fat | -13.8% |
| Contains more Mono. FatMonounsaturated fat | +109.8% |
| Contains more Poly. FatPolyunsaturated fat | +148.6% |
People also compare


References
All the values for which the sources are not specified explicitly are taken from FDA’s Food Central. The exact link to the food presented on this page can be found below.
- Clam - https://fdc.nal.usda.gov/fdc-app.html#/food-details/171975/nutrients
- Scallops - https://fdc.nal.usda.gov/fdc-app.html#/food-details/167742/nutrients
All the Daily Values are presented for males aged 31-50, for 2000-calorie diets.