Club sandwich vs. Submarine sandwich — In-Depth Nutrition Comparison
Compare
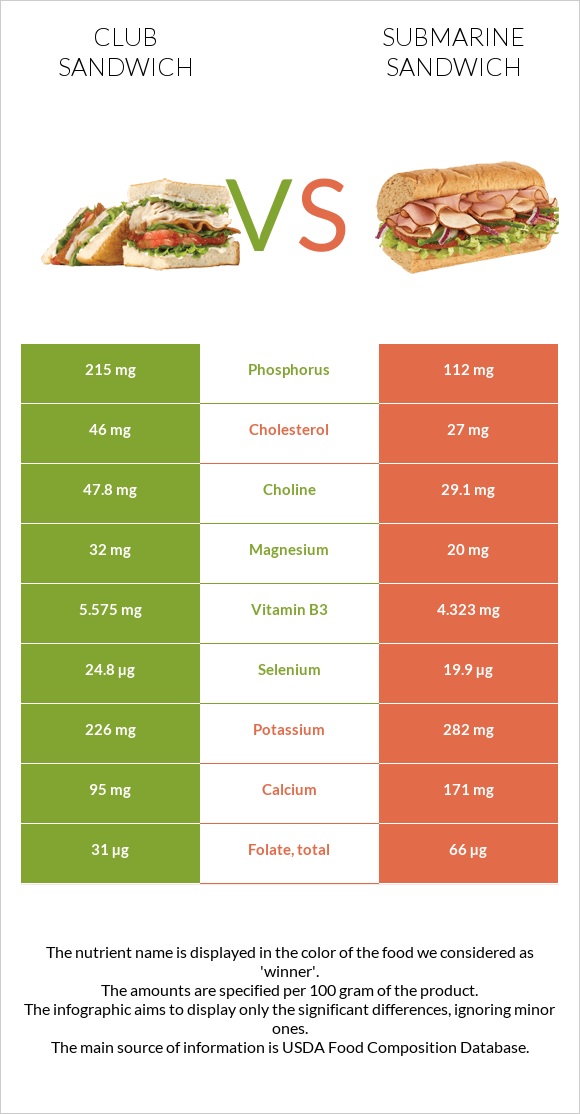
A recap on the differences between club sandwich and submarine sandwich
- Club sandwich has more phosphorus, vitamin B12, selenium, vitamin B3, and vitamin B6; however, submarine sandwich is higher in vitamin B1, folate, calcium, and vitamin B2.
- Club sandwich covers your daily phosphorus needs 15% more than submarine sandwich.
- Submarine sandwich contains 2 times less vitamin B12 than club sandwich. Club sandwich contains 0.47µg of vitamin B12, while submarine sandwich contains 0.22µg.
- Submarine sandwich has less cholesterol.
Food varieties used in this article are Fast foods, grilled chicken, bacon, and tomato club sandwich, with cheese, lettuce, and mayonnaise and Fast foods, submarine sandwich, cold cut on white bread with lettuce and tomato.
Infographic
Infographic link
Mineral Comparison
Mineral comparison score is based on the number of minerals by which one or the other food is richer. The "coverage" charts below show how much of the daily needs can be covered by 300 grams of the food.
| Contains more MagnesiumMagnesium | +60% |
| Contains more ZincZinc | +27.6% |
| Contains more PhosphorusPhosphorus | +92% |
| Contains more SeleniumSelenium | +24.6% |
| Contains more CalciumCalcium | +80% |
| Contains more PotassiumPotassium | +24.8% |
| Contains more IronIron | +32.1% |
Vitamin Comparison
Vitamin comparison score is based on the number of vitamins by which one or the other food is richer. The "coverage" charts below show how much of the daily needs can be covered by 300 grams of the food.
| Contains more Vitamin AVitamin A | +59.1% |
| Contains more Vitamin EVitamin E | +48.8% |
| Contains more Vitamin B3Vitamin B3 | +29% |
| Contains more Vitamin B5Vitamin B5 | +48.8% |
| Contains more Vitamin B6Vitamin B6 | +45.8% |
| Contains more Vitamin B12Vitamin B12 | +113.6% |
| Contains more Vitamin KVitamin K | +93.3% |
| Contains more Vitamin CVitamin C | +70.5% |
| Contains more Vitamin DVitamin D | +100% |
| Contains more Vitamin B1Vitamin B1 | +99.4% |
| Contains more Vitamin B2Vitamin B2 | +43.5% |
| Contains more FolateFolate | +112.9% |
All nutrients comparison - raw data values
| Nutrient |  |
 |
DV% diff. |
| Phosphorus | 215mg | 112mg | 15% |
| Manganese | 0.354mg | 15% | |
| Vitamin B1 | 0.172mg | 0.343mg | 14% |
| Protein | 17.19g | 10.52g | 13% |
| Vitamin B12 | 0.47µg | 0.22µg | 10% |
| Selenium | 24.8µg | 19.9µg | 9% |
| Folate | 31µg | 66µg | 9% |
| Calcium | 95mg | 171mg | 8% |
| Vitamin B3 | 5.575mg | 4.323mg | 8% |
| Vitamin B6 | 0.296mg | 0.203mg | 7% |
| Cholesterol | 46mg | 27mg | 6% |
| Iron | 1.37mg | 1.81mg | 6% |
| Starch | 15.67g | 6% | |
| Vitamin B2 | 0.186mg | 0.267mg | 6% |
| Vitamin B5 | 0.826mg | 0.555mg | 5% |
| Vitamin K | 8.7µg | 4.5µg | 4% |
| Fats | 8.05g | 10.04g | 3% |
| Vitamin C | 4.4mg | 7.5mg | 3% |
| Magnesium | 32mg | 20mg | 3% |
| Zinc | 1.34mg | 1.05mg | 3% |
| Choline | 47.8mg | 29.1mg | 3% |
| Potassium | 226mg | 282mg | 2% |
| Sodium | 630mg | 575mg | 2% |
| Saturated fat | 3.109g | 3.554g | 2% |
| Monounsaturated fat | 2.949g | 3.716g | 2% |
| Fructose | 1.4g | 2% | |
| Vitamin D | 0.1µg | 0.2µg | 1% |
| Copper | 0.089mg | 0.084mg | 1% |
| Vitamin A | 35µg | 22µg | 1% |
| Vitamin E | 0.61mg | 0.41mg | 1% |
| Calories | 220kcal | 213kcal | 0% |
| Protein per 100 calories | 7.8g | 4.9g | N/A |
| Calories per 10 g protein | 128kcal | 202kcal | N/A |
| Weight per 100 calories | 45g | 47g | N/A |
| Unsaturated / Saturated Fat ratio | 1.6 | 1.6 | N/A |
| Net carbs | 18.67g | 19.23g | N/A |
| Carbs | 19.87g | 20.43g | 0% |
| Vitamin D* | 5 IU | 7 IU | 0% |
| Sugar | 4.68g | 3.18g | N/A |
| Fiber | 1.2g | 1.2g | 0% |
| Trans fat | 0.071g | 0.119g | N/A |
| Polyunsaturated fat | 1.88g | 1.927g | 0% |
| Tryptophan | 0.1mg | 0% | |
| Threonine | 0.331mg | 0% | |
| Isoleucine | 0.431mg | 0% | |
| Leucine | 0.752mg | 0% | |
| Lysine | 0.491mg | 0% | |
| Methionine | 0.21mg | 0% | |
| Phenylalanine | 0.431mg | 0% | |
| Valine | 0.501mg | 0% | |
| Histidine | 0.301mg | 0% | |
| Omega-3 - EPA | 0.004g | 0.001g | N/A |
| Omega-3 - DHA | 0.007g | 0.002g | N/A |
| Omega-3 - ALA | 0.104g | N/A | |
| Omega-3 - DPA | 0.004g | 0.005g | N/A |
| Omega-3 - Eicosatrienoic acid | 0.004g | N/A | |
| Omega-6 - Gamma-linoleic acid | 0.003g | N/A | |
| Omega-6 - Dihomo-gamma-linoleic acid | 0.013g | N/A | |
| Omega-6 - Eicosadienoic acid | 0.048g | N/A | |
| Omega-6 - Linoleic acid | 1.665g | N/A |
Macronutrient Comparison
Macronutrient breakdown side-by-side comparison
Protein:
17.19 g
Fats:
8.05 g
Carbs:
19.87 g
Water:
52.52 g
Other:
2.37 g
Protein:
10.52 g
Fats:
10.04 g
Carbs:
20.43 g
Water:
56.51 g
Other:
2.5 g
| Contains more ProteinProtein | +63.4% |
| Contains more FatsFats | +24.7% |
~equal in
Carbs
~20.43g
~equal in
Water
~56.51g
~equal in
Other
~2.5g
Fat Type Comparison
Fat type breakdown side-by-side comparison
Saturated fat:
Sat. Fat
3.109 g
Monounsaturated fat:
Mono. Fat
2.949 g
Polyunsaturated fat:
Poly. Fat
1.88 g
Saturated fat:
Sat. Fat
3.554 g
Monounsaturated fat:
Mono. Fat
3.716 g
Polyunsaturated fat:
Poly. Fat
1.927 g
| Contains less Sat. FatSaturated fat | -12.5% |
| Contains more Mono. FatMonounsaturated fat | +26% |
~equal in
Polyunsaturated fat
~1.927g


