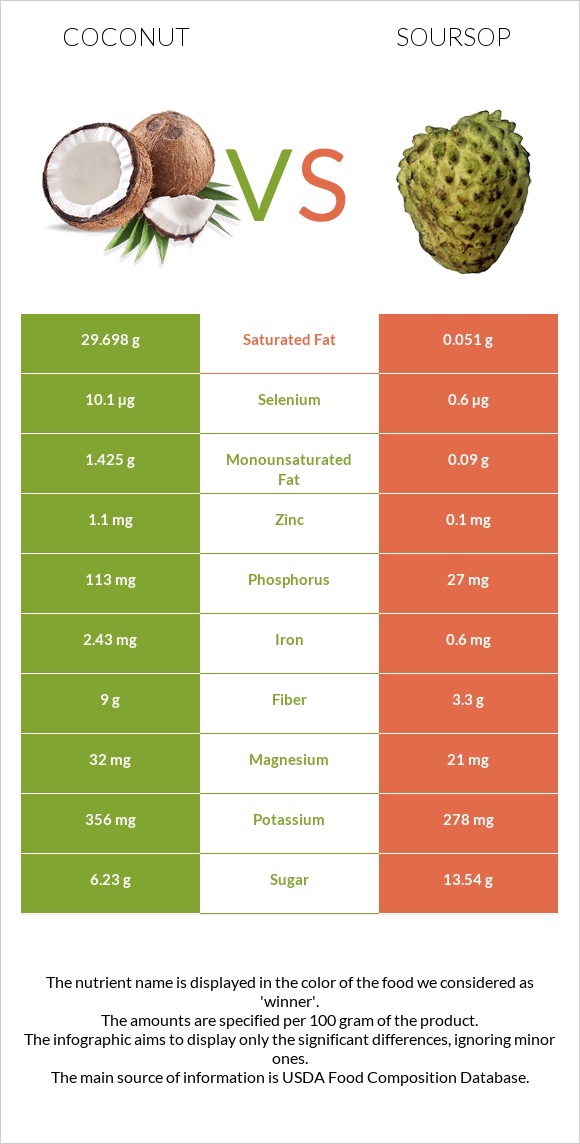
How are coconut and soursop different? Coconut is higher in copper, iron, fiber, selenium, phosphorus, and zinc; however, soursop is richer in vitamin C. Daily need coverage for saturated fat for coconut is 148% higher. Coconut contains 17 times more selenium than soursop. While coconut contains 10.1µg of selenium, soursop contains only 0.6µg. Soursop has less saturated fat. Soursop has a lower glycemic index (32) than coconut (59). Nuts, coconut meat, raw and Soursop, raw are the varieties used in this article.
Infographic
Mineral Comparison
Mineral comparison score is based on the number of minerals by which one or the other food is richer. The "coverage" charts below show how much of the daily needs can be covered by 300 grams of the food.
8
100 g
300 g
1 piece (2" x 2" x 1/2") - 45g 1 cup, shredded - 80g 1 medium - 397g
Magnesium
Magnesium
Calcium
Calcium
Potassium
Potassium
Iron
Iron
Copper
Copper
Zinc
Zinc
Phosphorus
Phosphorus
Sodium
Sodium
Manganese
Manganese
Selenium
Selenium
23%
4.2%
31%
91%
145%
30%
48%
2.6%
196%
55%
1
100 g
300 g
1 cup, pulp - 225g 1 fruit (7" x 5-1/4" dia) - 625g
Magnesium
Magnesium
Calcium
Calcium
Potassium
Potassium
Iron
Iron
Copper
Copper
Zinc
Zinc
Phosphorus
Phosphorus
Sodium
Sodium
Manganese
Manganese
Selenium
Selenium
15%
4.2%
25%
23%
29%
2.7%
12%
1.8%
0%
3.3%
Vitamin Comparison
Vitamin comparison score is based on the number of vitamins by which one or the other food is richer. The "coverage" charts below show how much of the daily needs can be covered by 300 grams of the food.
3
100 g
300 g
1 piece (2" x 2" x 1/2") - 45g 1 cup, shredded - 80g 1 medium - 397g
Vitamin C
Vit. C
Vitamin D
Vit. D
Vitamin A
Vit. A
Vitamin E
Vit. E
Vitamin B1
Vit. B1
Vitamin B2
Vit. B2
Vitamin B3
Vit. B3
Vitamin B5
Vit. B5
Vitamin B6
Vit. B6
Vitamin B12
Vit. B12
Vitamin K
Vit. K
Folate
Folate
11%
0%
0%
4.8%
17%
4.6%
10%
18%
12%
0%
0.5%
20%
4
100 g
300 g
1 cup, pulp - 225g 1 fruit (7" x 5-1/4" dia) - 625g
Vitamin C
Vit. C
Vitamin D
Vit. D
Vitamin A
Vit. A
Vitamin E
Vit. E
Vitamin B1
Vit. B1
Vitamin B2
Vit. B2
Vitamin B3
Vit. B3
Vitamin B5
Vit. B5
Vitamin B6
Vit. B6
Vitamin B12
Vit. B12
Vitamin K
Vit. K
Folate
Folate
69%
0%
0%
1.6%
18%
12%
17%
15%
14%
0%
1%
11%
All nutrients comparison - raw data values
Nutrient
DV% diff.
Saturated fat
29.698g
0.051g
135%
Manganese
1.5mg
65%
Fats
33.49g
0.3g
51%
Copper
0.435mg
0.086mg
39%
Iron
2.43mg
0.6mg
23%
Fiber
9g
3.3g
23%
Vitamin C
3.3mg
20.6mg
19%
Selenium
10.1µg
0.6µg
17%
Calories
354kcal
66kcal
14%
Phosphorus
113mg
27mg
12%
Zinc
1.1mg
0.1mg
9%
Protein
3.33g
1g
5%
Magnesium
32mg
21mg
3%
Folate
26µg
14µg
3%
Monounsaturated fat
1.425g
0.09g
3%
Potassium
356mg
278mg
2%
Vitamin B2
0.02mg
0.05mg
2%
Vitamin B3
0.54mg
0.9mg
2%
Polyunsaturated fat
0.366g
0.069g
2%
Carbs
15.23g
16.84g
1%
Vitamin E
0.24mg
0.08mg
1%
Vitamin B5
0.3mg
0.253mg
1%
Choline
12.1mg
7.6mg
1%
Protein per 100 calories
0.94g
1.5g
N/A
Calories per 10 g protein
1063kcal
660kcal
N/A
Weight per 100 calories
28g
152g
N/A
Unsaturated / Saturated Fat ratio
0.06
3.1
N/A
Net carbs
6.23g
13.54g
N/A
Calcium
14mg
14mg
0%
Sugar
6.23g
13.54g
N/A
Sodium
20mg
14mg
0%
Vitamin B1
0.066mg
0.07mg
0%
Vitamin B6
0.054mg
0.059mg
0%
Vitamin K
0.2µg
0.4µg
0%
Tryptophan
0.039mg
0.011mg
0%
Threonine
0.121mg
0%
Isoleucine
0.131mg
0%
Leucine
0.247mg
0%
Lysine
0.147mg
0.06mg
0%
Methionine
0.062mg
0.007mg
0%
Phenylalanine
0.169mg
0%
Valine
0.202mg
0%
Histidine
0.077mg
0%
Macronutrient Comparison
Macronutrient breakdown side-by-side comparison
3
3%
33%
15%
47%
Protein:
3.33 g
Fats:
33.49 g
Carbs:
15.23 g
Water:
46.99 g
Other:
0.96 g
2
17%
81%
Protein:
1 g
Fats:
0.3 g
Carbs:
16.84 g
Water:
81.16 g
Other:
0.7 g
Contains
more
Protein Protein
+233%
Contains
more
Fats Fats
+11063.3%
Contains
more
Other Other
+37.1%
Contains
more
Carbs Carbs
+10.6%
Contains
more
Water Water
+72.7%
Fat Type Comparison
Fat type breakdown side-by-side comparison
2
94%
5%
Saturated fat:
Sat. Fat
29.698 g
Monounsaturated fat:
Mono. Fat
1.425 g
Polyunsaturated fat:
Poly. Fat
0.366 g
1
24%
43%
33%
Saturated fat:
Sat. Fat
0.051 g
Monounsaturated fat:
Mono. Fat
0.09 g
Polyunsaturated fat:
Poly. Fat
0.069 g
Contains
more
Mono. Fat Monounsaturated fat
+1483.3%
Contains
more
Poly. Fat Polyunsaturated fat
+430.4%
Contains
less
Sat. Fat Saturated fat
-99.8%