What are the main differences between cod and octopus? Cod has less vitamin B12, iron, selenium, copper, vitamin B6, zinc, phosphorus, and vitamin B5 than octopus. Octopus's daily need coverage for vitamin B12 is 1456% higher. We used Fish, cod, Atlantic, cooked, dry heat and Mollusks, octopus, common, cooked, moist heat types in this comparison.
Infographic
Mineral Comparison
Mineral comparison score is based on the number of minerals by which one or the other food is richer. The "coverage" charts below show how much of the daily needs can be covered by 300 grams of the food.
1
100 g
300 g
3 oz - 85g 1 fillet - 180g
Magnesium
Magnesium
Calcium
Calcium
Potassium
Potassium
Iron
Iron
Copper
Copper
Zinc
Zinc
Phosphorus
Phosphorus
Sodium
Sodium
Manganese
Manganese
Selenium
Selenium
30%
4.2%
22%
18%
12%
16%
59%
10%
2.6%
205%
9
100 g
300 g
3 oz - 85g
Magnesium
Magnesium
Calcium
Calcium
Potassium
Potassium
Iron
Iron
Copper
Copper
Zinc
Zinc
Phosphorus
Phosphorus
Sodium
Sodium
Manganese
Manganese
Selenium
Selenium
43%
32%
56%
358%
246%
92%
120%
60%
6.1%
489%
Vitamin Comparison
Vitamin comparison score is based on the number of vitamins by which one or the other food is richer. The "coverage" charts below show how much of the daily needs can be covered by 300 grams of the food.
2
100 g
300 g
3 oz - 85g 1 fillet - 180g
Vitamin C
Vit. C
Vitamin D
Vit. D
Vitamin A
Vit. A
Vitamin E
Vit. E
Vitamin B1
Vit. B1
Vitamin B2
Vit. B2
Vitamin B3
Vit. B3
Vitamin B5
Vit. B5
Vitamin B6
Vit. B6
Vitamin B12
Vit. B12
Vitamin K
Vit. K
Folate
Folate
3.3%
18%
4.7%
16%
22%
18%
47%
11%
65%
131%
0.25%
6%
8
100 g
300 g
3 oz - 85g
Vitamin C
Vit. C
Vitamin D
Vit. D
Vitamin A
Vit. A
Vitamin E
Vit. E
Vitamin B1
Vit. B1
Vitamin B2
Vit. B2
Vitamin B3
Vit. B3
Vitamin B5
Vit. B5
Vitamin B6
Vit. B6
Vitamin B12
Vit. B12
Vitamin K
Vit. K
Folate
Folate
27%
0%
30%
24%
14%
18%
71%
54%
150%
4500%
0.25%
18%
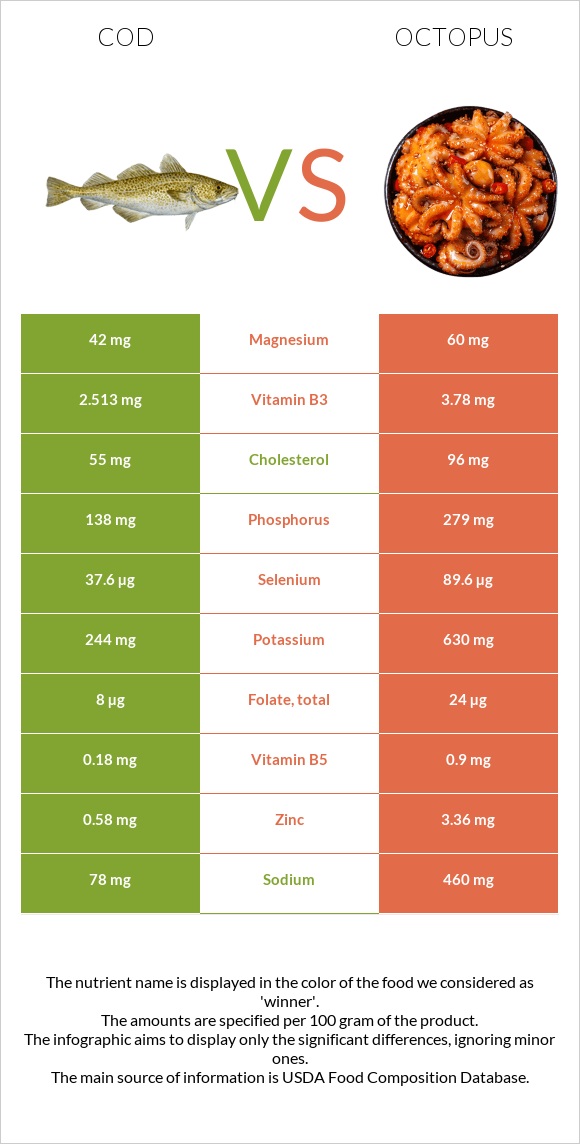
All nutrients comparison - raw data values
Nutrient
DV% diff.
Vitamin B12
1.05µg
36µg
1456%
Iron
0.49mg
9.54mg
113%
Selenium
37.6µg
89.6µg
95%
Copper
0.036mg
0.739mg
78%
Vitamin B6
0.283mg
0.648mg
28%
Zinc
0.58mg
3.36mg
25%
Phosphorus
138mg
279mg
20%
Sodium
78mg
460mg
17%
Protein
22.83g
29.82g
14%
Cholesterol
55mg
96mg
14%
Vitamin B5
0.18mg
0.9mg
14%
Potassium
244mg
630mg
11%
Calcium
14mg
106mg
9%
Vitamin C
1mg
8mg
8%
Vitamin A
14µg
90µg
8%
Vitamin B3
2.513mg
3.78mg
8%
Vitamin D*
46 IU
0 IU
6%
Vitamin D
1.2µg
0µg
6%
Magnesium
42mg
60mg
4%
Folate
8µg
24µg
4%
Calories
105kcal
164kcal
3%
Vitamin E
0.81mg
1.2mg
3%
Vitamin B1
0.088mg
0.057mg
3%
Fats
0.86g
2.08g
2%
Carbs
0g
4.4g
1%
Manganese
0.02mg
0.047mg
1%
Saturated fat
0.168g
0.453g
1%
Monounsaturated fat
0.124g
0.324g
1%
Polyunsaturated fat
0.292g
0.477g
1%
Protein per 100 calories
22g
18g
N/A
Calories per 10 g protein
46kcal
55kcal
N/A
Weight per 100 calories
95g
61g
N/A
Unsaturated / Saturated Fat ratio
2.5
1.8
N/A
Net carbs
0g
4.4g
N/A
Vitamin B2
0.079mg
0.076mg
0%
Vitamin K
0.1µg
0.1µg
0%
Choline
83.7mg
81mg
0%
Tryptophan
0.256mg
0.334mg
0%
Threonine
1.001mg
1.283mg
0%
Isoleucine
1.052mg
1.298mg
0%
Leucine
1.856mg
2.099mg
0%
Lysine
2.097mg
2.228mg
0%
Methionine
0.676mg
0.673mg
0%
Phenylalanine
0.891mg
1.069mg
0%
Valine
1.176mg
1.303mg
0%
Histidine
0.672mg
0.573mg
0%
Omega-3 - EPA
0.004g
0.152g
N/A
Omega-3 - DHA
0.154g
0.162g
N/A
Omega-3 - DPA
0.013g
0.012g
N/A
Macronutrient Comparison
Macronutrient breakdown side-by-side comparison
1
23%
76%
Protein:
22.83 g
Fats:
0.86 g
Carbs:
0 g
Water:
75.92 g
Other:
0.39 g
4
30%
2%
4%
61%
3%
Protein:
29.82 g
Fats:
2.08 g
Carbs:
4.4 g
Water:
60.5 g
Other:
3.2 g
Contains
more
Water Water
+25.5%
Contains
more
Protein Protein
+30.6%
Contains
more
Fats Fats
+141.9%
Contains
more
Carbs Carbs
+∞%
Contains
more
Other Other
+720.5%
Fat Type Comparison
Fat type breakdown side-by-side comparison
1
29%
21%
50%
Saturated fat:
Sat. Fat
0.168 g
Monounsaturated fat:
Mono. Fat
0.124 g
Polyunsaturated fat:
Poly. Fat
0.292 g
2
36%
26%
38%
Saturated fat:
Sat. Fat
0.453 g
Monounsaturated fat:
Mono. Fat
0.324 g
Polyunsaturated fat:
Poly. Fat
0.477 g
Contains
less
Sat. Fat Saturated fat
-62.9%
Contains
more
Mono. Fat Monounsaturated fat
+161.3%
Contains
more
Poly. Fat Polyunsaturated fat
+63.4%