Cod vs. Perch — Health Impact and Nutrition Comparison


Summary
Cod and perch contain completeness proteins, which contain all nine essential amino acids that human bodies cannot make on their own. Perch contains a higher concentration of omega-3, monounsaturated, and saturated fats than cod. Both of them are carb-free.
Perch has a higher mineral content than cod; however, cod contains twice the quantity of selenium. Both fishes have an equal amount of Vitamin B1.
Introduction
In this article, you can find the main nutritional differences between perch and cod also their impact on human health.
Habitat
Pacific Ocean perch can be found off the coasts of North America, from California to Alaska's Western Aleutian Islands, compared to cod, which can be found from Greenland to Cape Hatteras, North Carolina, in the Northwest Atlantic. Cod is most frequent in US waters on Georges Bank and in the western Gulf of Maine.
Atlantic cod reside near the seafloor on rocky ledges and slopes. They prefer cold water at depths of 30 to 500 feet. As for the Pacific perch, larvae and immature juveniles reside near the surface, whereas adults and older juveniles inhabit the ocean floor. Adults reproduce and reside in shallow waters in the summer and offshore in the fall and winter.
Appearence
Atlantic cod have a huge head, a blunt snout, and a conspicuous barbel (a whisker-like structure similar to that of a catfish) under the lower jaw. Their colors range from light yellowish-green to red and olive, with darker speckles on the head, fins, tail, and body. Because of their color, brown or grayish with dark patches or patterns on the flanks and a paler belly, Pacific cod are also known as gray cod. As for Pacific perch, their upper backs are pale red with several diffuse olive-green patches. They also have a conspicuous, cone-shaped bump on the bottom of their jaw.
Biology
In comparison to Pacific perch, which grows slowly and can live to be 98 years old, Atlantic cod can live for more than 20 years.
Atlantic cod can grow to be 51 inches long and weigh 77 pounds, whereas Pacific perch can grow to be 20 inches long and weigh 4 pounds.
When compared to Pacific perch, Atlantic cod can breed around 2 to 3 years old, when they are between 12 and 16 inches long, whereas Pacific perch cannot reproduce until they are around 10 years old.
Nutrition
The food types discussed in this article are raw perch and raw cod. You can look at nutrition infographics at the bottom of the page to better understand the difference between these two fishes.
Calories
Both perch and cod are considered moderate-calories foods. The calories per 100g of cod and perch are 105 and 117, respectively.
Proteins
The amounts of protein in perch and cod are almost equal: perch contains 24.86g, and cod has 22.83g of protein per 100g. Both fishes contain high amounts of essential amino acids, such as tryptophan, lysine, histidine, phenylalanine, isoleucine, leucine, valine, methionine, and threonine.
Completeness proteins are those that contain all nine essential amino acids that human bodies cannot make on their own, such as the proteins of cod and perch.
It should be mentioned that the smallest allowed daily protein amount is 55–60g (0.7g per kg of body weight), while the recommended amount is 85–90g, with animal proteins accounting for 55%. Based on the previous information, it follows that consumption of cod and perch may fill this 55%.
Fats
Perch has over 1.4 times the fat content of cod, with 1.18g per 100g vs. 0.86g for the same serving of cod. Perch has twice as much cholesterol as cod, with 115mg per 100g compared to 55mg per 100g for cod. Perch has more omega-3, monounsaturated, and saturated fats than cod.
Carbs
The carb content of cod and perch is zero.
Minerals
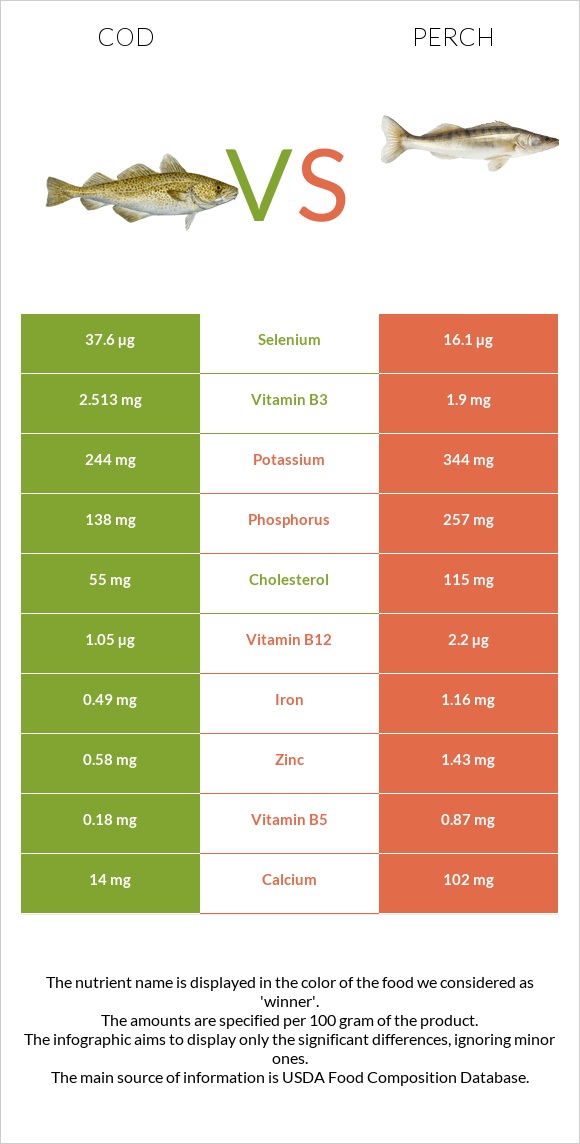
Perch has a higher mineral content than cod. When compared to cod, perch is 7 times richer in calcium, nearly twice as rich in iron, 1.8 times richer in phosphorus, 1.4 times richer in potassium, 2.5 times richer in zinc, 5 times richer in copper, and 45 times richer in manganese. When compared to perch, cod has twice the amount of selenium.
Both have nearly identical magnesium and sodium amounts.
Mineral Comparison
Contains
more
SeleniumSelenium
+133.5%
Contains
more
CalciumCalcium
+628.6%
Contains
more
PotassiumPotassium
+41%
Contains
more
IronIron
+136.7%
Contains
more
CopperCopper
+433.3%
Contains
more
ZincZinc
+146.6%
Contains
more
PhosphorusPhosphorus
+86.2%
Contains
more
ManganeseManganese
+4400%
Vitamins
Cod is two times richer in vitamin B6 than perch; it is also high in vitamin B3, B9, and vitamin A. Perch is 1.5 times richer in vitamin B2, 4.8 times richer in vitamin B5, 2 times richer in vitamin B12, and 1.7 times richer in vitamin C compared to cod.
Both fishes have an equal amount of Vitamin B1.
Vitamin Comparison
Contains
more
Vitamin DVitamin D
+∞%
Contains
more
Vitamin AVitamin A
+40%
Contains
more
Vitamin EVitamin E
+∞%
Contains
more
Vitamin B3Vitamin B3
+32.3%
Contains
more
Vitamin B6Vitamin B6
+102.1%
Contains
more
Vitamin KVitamin K
+∞%
Contains
more
FolateFolate
+33.3%
Contains
more
Vitamin CVitamin C
+70%
Contains
more
Vitamin B2Vitamin B2
+51.9%
Contains
more
Vitamin B5Vitamin B5
+383.3%
Contains
more
Vitamin B12Vitamin B12
+109.5%
Weight Loss and Diet
The keto diet is appropriate for cod and perch since they contain no carbs.
The Mediterranean diet can also include them. It should be noted that a number of studies and meta-analyses have found that the Mediterranean diet reduces the risk of cardiovascular events and all-cause mortality (2).
Although cod and perch are high in many nutrients, they are medium-calorie foods and should be consumed in moderation when on weight-loss diets.
Health Benefits
Cardiovascular Health
Peptides found in cod may inhibit the angiotensin-converting enzyme (ACE). One of the mechanisms that may lower arterial blood pressure is ACE inhibition. Some antihypertension medications (such as Captopril, Ramipril, Lisinopril, and others) function through the same mechanism (1.2). Unlike cod, there are no studies that show a direct link between the consumption of perch and lowering blood pressure. Still, the omega-3 in it helps lower blood pressure through a variety of mechanisms, including ACE inhibition (3).
According to this cohort study, omega-3 may decrease heart rate, which is important for appropriate cardiac muscle blood supply (3).
Omega-3 fatty acids, protein with vitamins, and even unknown bioactive substances in cod and perch may also play a role in the prevention of cardiovascular disease (such as myocardial infarction and stroke) through a variety of mechanisms, such as lowering circulating levels of total cholesterol, LDL (bad cholesterol), lipoproteins, and triglycerides. (4).
Combining omega-3 fatty acid therapy with baseline statin (such as Atorvastatin, Rosuvastatin, etc.) medication reduces triglycerides by another 29%. As a result, it improves the cardiovascular prognosis of patients with hyperlipidemia (5).
Several epidemiologic and animal studies have demonstrated that omega-3 fatty acids may significantly reduce the risk of atherosclerosis due to their anti-inflammatory characteristics and suppression of endothelial activation (5).
The proliferation of vascular smooth muscle cells is critical in the pathophysiology of atherosclerosis and re-stenosis (the diameter of the coronary artery lumen is lowered after angioplasty). Omega-3 fatty acids have been demonstrated to play a role in the suppression of smooth muscle cell growth (5).
A high omega-3 intake can be obtained by eating fish such as cod and perch twice to three times per week to achieve at least 500 mg/day, or by taking fish oil supplements on a regular basis (3).
Diabetes
Because cod and perch are high in omega-3 fatty acids, they may be useful to diabetics.
According to this rat study, consuming cod liver oil, which is high in omega-3 fatty acids, is associated with a number of biochemical changes that may be beneficial for diabetes, including lower triglyceridemia, increased fatty acid oxidation, higher HDL levels, and lower LDL levels. As a result, not only is hyperlipidemia reduced, but so is insulin resistance (6).
Another study found that omega-3 fatty acids may significantly reduce fasting blood glucose levels (7).
Liver Health
Cod and perch may help prevent fatty liver disease since they contain lipotropic omega-3. The optimal dose has yet to be discovered, but the effects are obvious at 20.83 grams of omega-3 per day. For more optimal statistics, further randomized trials are required (8).
Anemia
Because perch is higher in iron and cod is high in vitamins B9 and B12, both are recommended for anemia and may lower the risk of developing anemia (9).
Nervous system
Several epidemiological studies have found that adequate omega-3 intake or greater serum omega-3 levels are linked to a decreased incidence of depression. Low omega-3 levels have been linked to depressive or anxious moods, poor cognitive function, sleep disturbances, aggressiveness, and impulsive behavior (10). As already mentioned, eating fish such as cod and perch two to three times per week can offer a high omega-3 intake.
Immune system
Omega-3 fatty acids have been demonstrated in studies to reduce the symptoms of a variety of disorders (including sepsis and autoimmune hepatitis) by stimulating the immune system. Obtaining extensive information about the unique direct effect of omega-3 fatty acids on diverse immune system cells would allow future researchers and physicians to optimize and apply omega-3-rich supplements and foods (including cod and perch) for the treatment of a wide range of disorders (11).
Side Effects
Cod, like the majority of fish, contains mercury. Excessive mercury consumption is toxic and can lead to neurological and behavioral problems. It may be especially harmful to children. So, it is better to consume cod in moderation (12).
Perch is high in purines, which can cause kidney stones. A high purine intake causes increased uric acid production, and this concentration promotes the formation of uric acid stones (13).
References
- https://www.sciencedirect.com/science/article/abs/pii/S0271531713002704
- https://www.portailvasculaire.fr/sites/default/files/docs/2018_esc_esh_guidelines_hta.pdf
- https://www.cambridge.org/core/journals/british-journal-of-nutrition/article/omega3-fatty-acids-and-blood-pressure/C5B80492D2B8028AD8F95FFAAF5F44DF
- https://link.springer.com/article/10.1186/s12986-016-0068-z
- https://www.ncbi.nlm.nih.gov/pmc/articles/PMC3712371/
- https://www.fayoum.edu.eg/scien/Chemistry/pdf/codliverOil.pdf
- https://www.tandfonline.com/doi/abs/10.1080/10408398.2021.1875977
- https://www.sciencedirect.com/science/article/pii/S0168827811007409
- https://www.hey.nhs.uk/wp/wp-content/uploads/2016/03/vitaminB12FolateDeficiency.pdf
- https://www.frontiersin.org/articles/10.3389/fpsyt.2022.933704/full
- https://www.mdpi.com/1422-0067/20/20/5028
- https://www.sciencedirect.com/science/article/abs/pii/S0013935107001168
- https://cdnsciencepub.com/doi/abs/10.1139/f69-176

Infographic
All nutrients comparison - raw data values
| Nutrient | |
|
DV% diff. |
| Vitamin B12 | 1.05µg | 2.2µg | 48% |
| Selenium | 37.6µg | 16.1µg | 39% |
| Manganese | 0.02mg | 0.9mg | 38% |
| Cholesterol | 55mg | 115mg | 20% |
| Copper | 0.036mg | 0.192mg | 17% |
| Phosphorus | 138mg | 257mg | 17% |
| Choline | 83.7mg | 15% | |
| Vitamin B5 | 0.18mg | 0.87mg | 14% |
| Vitamin B6 | 0.283mg | 0.14mg | 11% |
| Calcium | 14mg | 102mg | 9% |
| Iron | 0.49mg | 1.16mg | 8% |
| Zinc | 0.58mg | 1.43mg | 8% |
| Vitamin D* | 46 IU | 6% | |
| Vitamin D | 1.2µg | 6% | |
| Vitamin E | 0.81mg | 5% | |
| Protein | 22.83g | 24.86g | 4% |
| Vitamin B3 | 2.513mg | 1.9mg | 4% |
| Potassium | 244mg | 344mg | 3% |
| Vitamin B2 | 0.079mg | 0.12mg | 3% |
| Calories | 105kcal | 117kcal | 1% |
| Vitamin C | 1mg | 1.7mg | 1% |
| Magnesium | 42mg | 38mg | 1% |
| Vitamin B1 | 0.088mg | 0.08mg | 1% |
| Folate | 8µg | 6µg | 1% |
| Polyunsaturated fat | 0.292g | 0.472g | 1% |
| Protein per 100 calories | 22g | 21g | N/A |
| Calories per 10 g protein | 46kcal | 47kcal | N/A |
| Weight per 100 calories | 95g | 85g | N/A |
| Fats | 0.86g | 1.18g | 0% |
| Sodium | 78mg | 79mg | 0% |
| Vitamin A | 14µg | 10µg | 0% |
| Vitamin K | 0.1µg | 0% | |
| Saturated fat | 0.168g | 0.237g | 0% |
| Monounsaturated fat | 0.124g | 0.195g | 0% |
| Tryptophan | 0.256mg | 0.278mg | 0% |
| Threonine | 1.001mg | 1.09mg | 0% |
| Isoleucine | 1.052mg | 1.145mg | 0% |
| Leucine | 1.856mg | 2.02mg | 0% |
| Lysine | 2.097mg | 2.283mg | 0% |
| Methionine | 0.676mg | 0.736mg | 0% |
| Phenylalanine | 0.891mg | 0.97mg | 0% |
| Valine | 1.176mg | 1.281mg | 0% |
| Histidine | 0.672mg | 0.732mg | 0% |
| Omega-3 - EPA | 0.004g | 0.101g | N/A |
| Omega-3 - DHA | 0.154g | 0.223g | N/A |
| Omega-3 - DPA | 0.013g | 0.036g | N/A |
Macronutrient Comparison
| Contains more FatsFats | +37.2% |
| Contains more OtherOther | +82.1% |
Fat Type Comparison
| Contains less Sat. FatSaturated fat | -29.1% |
| Contains more Mono. FatMonounsaturated fat | +57.3% |
| Contains more Poly. FatPolyunsaturated fat | +61.6% |
People also compare


References
All the values for which the sources are not specified explicitly are taken from FDA’s Food Central. The exact link to the food presented on this page can be found below.
- Cod - https://fdc.nal.usda.gov/fdc-app.html#/food-details/171956/nutrients
- Perch - https://fdc.nal.usda.gov/fdc-app.html#/food-details/173679/nutrients
All the Daily Values are presented for males aged 31-50, for 2000-calorie diets.