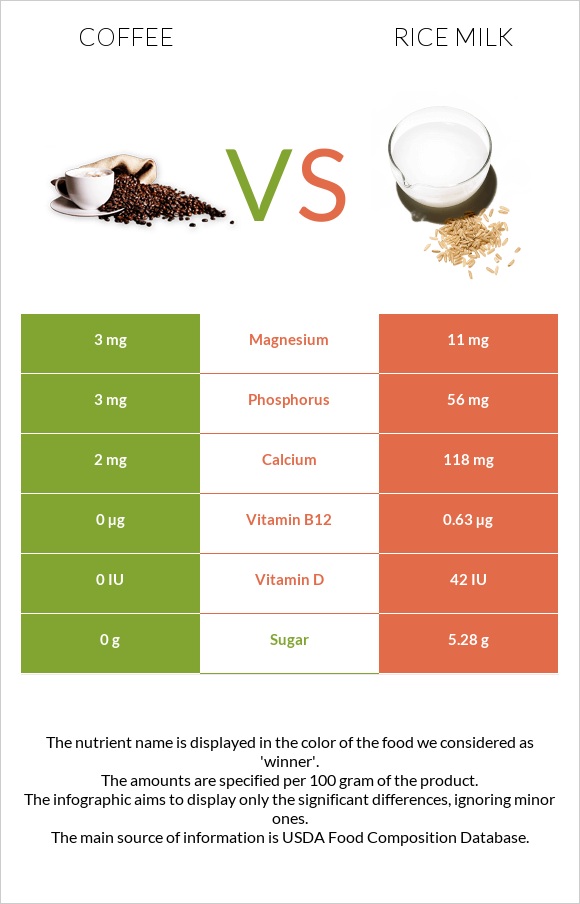
How are coffee and rice milk different? Coffee contains less vitamin B12, calcium, manganese, phosphorus, vitamin D* and vitamin B2 than rice milk. Rice milk covers your daily need for vitamin B12, 26% more than coffee. Rice milk has a higher glycemic index. The glycemic index of rice milk is 79, while the glycemic index of coffee is 0. Beverages, coffee, brewed, prepared with tap water and Beverages, rice milk, unsweetened types were used in this article.
Infographic
Mineral Comparison
Mineral comparison score is based on the number of minerals by which one or the other food is richer. The "coverage" charts below show how much of the daily needs can be covered by 300 grams of the food.
2
100 g
300 g
1 fl oz - 29.6g 6 fl oz - 178g 1 cup (8 fl oz) - 237g
Magnesium
Magnesium
Calcium
Calcium
Potassium
Potassium
Iron
Iron
Copper
Copper
Zinc
Zinc
Phosphorus
Phosphorus
Sodium
Sodium
Manganese
Manganese
Selenium
Selenium
2.1%
0.6%
4.3%
0.38%
0.67%
0.55%
1.3%
0.26%
3%
0%
8
100 g
300 g
8 fl oz (approximate weight, 1 serving) - 240g
Magnesium
Magnesium
Calcium
Calcium
Potassium
Potassium
Iron
Iron
Copper
Copper
Zinc
Zinc
Phosphorus
Phosphorus
Sodium
Sodium
Manganese
Manganese
Selenium
Selenium
7.9%
35%
2.4%
7.5%
12%
3.5%
24%
5.1%
37%
12%
Vitamin Comparison
Vitamin comparison score is based on the number of vitamins by which one or the other food is richer. The "coverage" charts below show how much of the daily needs can be covered by 300 grams of the food.
1
100 g
300 g
1 fl oz - 29.6g 6 fl oz - 178g 1 cup (8 fl oz) - 237g
Vitamin C
Vit. C
Vitamin D
Vit. D
Vitamin A
Vit. A
Vitamin E
Vit. E
Vitamin B1
Vit. B1
Vitamin B2
Vit. B2
Vitamin B3
Vit. B3
Vitamin B5
Vit. B5
Vitamin B6
Vit. B6
Vitamin B12
Vit. B12
Vitamin K
Vit. K
Folate
Folate
0%
0%
0%
0.2%
3.5%
18%
3.6%
15%
0.23%
0%
0.25%
1.5%
9
100 g
300 g
8 fl oz (approximate weight, 1 serving) - 240g
Vitamin C
Vit. C
Vitamin D
Vit. D
Vitamin A
Vit. A
Vitamin E
Vit. E
Vitamin B1
Vit. B1
Vitamin B2
Vit. B2
Vitamin B3
Vit. B3
Vitamin B5
Vit. B5
Vitamin B6
Vit. B6
Vitamin B12
Vit. B12
Vitamin K
Vit. K
Folate
Folate
0%
15%
21%
9.4%
6.8%
33%
7.3%
8.8%
9%
79%
0.5%
1.5%
All nutrients comparison - raw data values
Nutrient
DV% diff.
Vitamin B12
0µg
0.63µg
26%
Calcium
2mg
118mg
12%
Manganese
0.023mg
0.282mg
11%
Caffeine
40mg
0mg
10%
Phosphorus
3mg
56mg
8%
Vitamin A
0µg
63µg
7%
Vitamin D*
0 IU
42 IU
5%
Vitamin D
0µg
1µg
5%
Vitamin B2
0.076mg
0.142mg
5%
Copper
0.002mg
0.037mg
4%
Selenium
0µg
2.2µg
4%
Carbs
0g
9.17g
3%
Vitamin E
0.01mg
0.47mg
3%
Vitamin B6
0.001mg
0.039mg
3%
Calories
1kcal
47kcal
2%
Magnesium
3mg
11mg
2%
Iron
0.01mg
0.2mg
2%
Sodium
2mg
39mg
2%
Vitamin B5
0.254mg
0.146mg
2%
Monounsaturated fat
0.015g
0.625g
2%
Polyunsaturated fat
0.001g
0.313g
2%
Fats
0.02g
0.97g
1%
Potassium
49mg
27mg
1%
Fiber
0g
0.3g
1%
Zinc
0.02mg
0.13mg
1%
Vitamin B1
0.014mg
0.027mg
1%
Vitamin B3
0.191mg
0.39mg
1%
Protein
0.12g
0.28g
0%
Protein per 100 calories
12g
0.6g
N/A
Calories per 10 g protein
83kcal
1679kcal
N/A
Weight per 100 calories
10000g
213g
N/A
Net carbs
0g
8.87g
N/A
Sugar
0g
5.28g
N/A
Vitamin K
0.1µg
0.2µg
0%
Folate
2µg
2µg
0%
Choline
2.6mg
2.1mg
0%
Saturated fat
0.002g
0g
0%
Threonine
0.001mg
0%
Isoleucine
0.002mg
0%
Leucine
0.005mg
0%
Lysine
0.001mg
0%
Phenylalanine
0.003mg
0%
Valine
0.003mg
0%
Histidine
0.002mg
0%
Macronutrient Comparison
Macronutrient breakdown side-by-side comparison
2
99%
Protein:
0.12 g
Fats:
0.02 g
Carbs:
0 g
Water:
99.39 g
Other:
0.47 g
3
9%
89%
Protein:
0.28 g
Fats:
0.97 g
Carbs:
9.17 g
Water:
89.28 g
Other:
0.3 g
Contains
more
Water Water
+11.3%
Contains
more
Other Other
+56.7%
Contains
more
Protein Protein
+133.3%
Contains
more
Fats Fats
+4750%
Contains
more
Carbs Carbs
+∞%
Fat Type Comparison
Fat type breakdown side-by-side comparison
0
11%
83%
6%
Saturated fat:
Sat. Fat
0.002 g
Monounsaturated fat:
Mono. Fat
0.015 g
Polyunsaturated fat:
Poly. Fat
0.001 g
3
67%
33%
Saturated fat:
Sat. Fat
0 g
Monounsaturated fat:
Mono. Fat
0.625 g
Polyunsaturated fat:
Poly. Fat
0.313 g
Contains
less
Sat. Fat Saturated fat
-100%
Contains
more
Mono. Fat Monounsaturated fat
+4066.7%
Contains
more
Poly. Fat Polyunsaturated fat
+31200%