Corn oil vs. Fish oil — In-Depth Nutrition Comparison
Compare
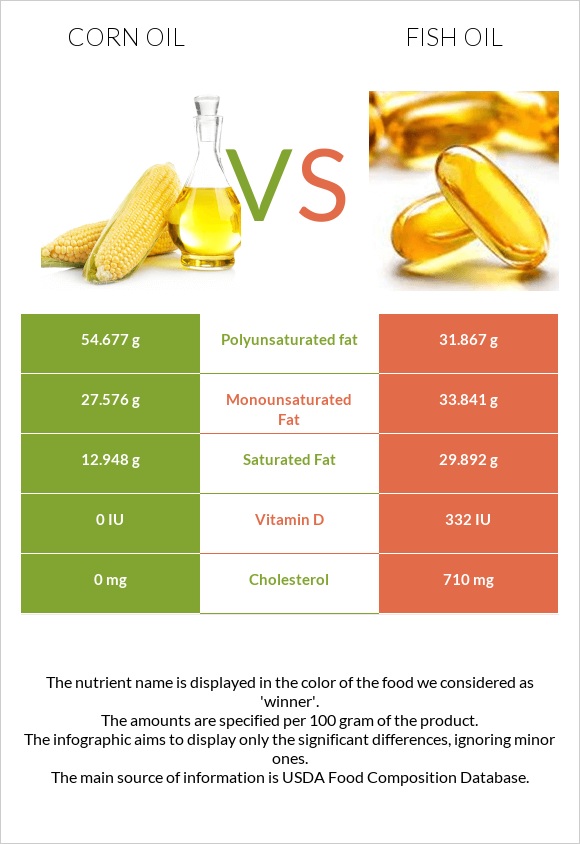
Important differences between corn oil and fish oil
- Corn oil has more polyunsaturated fat; however, fish oil has more vitamin D* and monounsaturated fat.
- Fish oil's daily need coverage for cholesterol is 237% more.
- Corn oil has 2 times more polyunsaturated fat than fish oil. Corn oil has 54.677g of polyunsaturated fat, while fish oil has 31.867g.
- Corn oil is lower in saturated fat.
The food varieties used in the comparison are Oil, corn, industrial, and retail, all purpose salad or cooking and Fish oil, sardine.
Infographic
Infographic link
Mineral Comparison
Mineral comparison score is based on the number of minerals by which one or the other food is richer. The "coverage" charts below show how much of the daily needs can be covered by 300 grams of the food.
Vitamin Comparison
Vitamin comparison score is based on the number of vitamins by which one or the other food is richer. The "coverage" charts below show how much of the daily needs can be covered by 300 grams of the food.
| Contains more Vitamin EVitamin E | +∞% |
| Contains more Vitamin KVitamin K | +∞% |
| Contains more Vitamin DVitamin D | +∞% |
All nutrients comparison - raw data values
| Nutrient |  |
 |
DV% diff. |
| Cholesterol | 0mg | 710mg | 237% |
| Polyunsaturated fat | 54.677g | 31.867g | 152% |
| Vitamin E | 14.3mg | 95% | |
| Saturated fat | 12.948g | 29.892g | 77% |
| Vitamin D* | 0 IU | 332 IU | 42% |
| Vitamin D | 0µg | 8.3µg | 42% |
| Monounsaturated fat | 27.576g | 33.841g | 16% |
| Vitamin K | 1.9µg | 2% | |
| Calories | 900kcal | 902kcal | 0% |
| Weight per 100 calories | 11g | 11g | N/A |
| Fats | 100g | 100g | 0% |
| Unsaturated / Saturated Fat ratio | 6.4 | 2.2 | N/A |
| Choline | 0.2mg | 0% | |
| Omega-3 - EPA | 0g | 10.137g | N/A |
| Omega-3 - DHA | 0g | 10.656g | N/A |
| Omega-3 - ALA | 1.161g | N/A | |
| Omega-3 - DPA | 0g | 1.973g | N/A |
| Omega-6 - Linoleic acid | 53.23g | N/A |
Macronutrient Comparison
Macronutrient breakdown side-by-side comparison
~equal in
Protein
~0g
~equal in
Fats
~100g
~equal in
Carbs
~0g
~equal in
Water
~0g
~equal in
Other
~0g
Fat Type Comparison
Fat type breakdown side-by-side comparison
| Contains less Sat. FatSaturated fat | -56.7% |
| Contains more Poly. FatPolyunsaturated fat | +71.6% |
| Contains more Mono. FatMonounsaturated fat | +22.7% |


