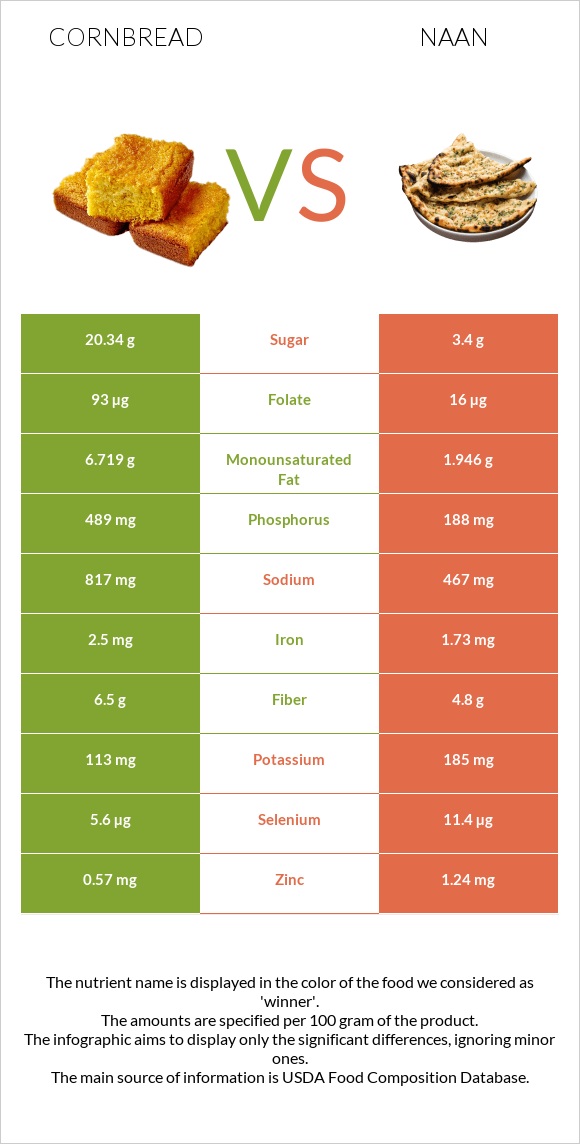
Significant differences between cornbread and naan Cornbread has more phosphorus, folate, vitamin B12, and choline; however, naan is richer in manganese, magnesium, fiber, vitamin B3, and copper. Naan covers your daily manganese needs 51% more than cornbread. Naan contains less cholesterol. Specific food types used in this comparison are Bread, cornbread, dry mix, prepared with 2% milk, 80% margarine, and eggs and Bread, naan, whole wheat, commercially prepared, refrigerated .
Infographic
Mineral Comparison
Mineral comparison score is based on the number of minerals by which one or the other food is richer. The "coverage" charts below show how much of the daily needs can be covered by 300 grams of the food.
2
100 g
300 g
1 oz - 28.35g 1 muffin - 51g 1 piece - 60g
Magnesium
Magnesium
Calcium
Calcium
Potassium
Potassium
Iron
Iron
Copper
Copper
Zinc
Zinc
Phosphorus
Phosphorus
Sodium
Sodium
Manganese
Manganese
Selenium
Selenium
12%
41%
12%
69%
24%
18%
168%
78%
29%
47%
7
100 g
300 g
1 piece - 106g
Magnesium
Magnesium
Calcium
Calcium
Potassium
Potassium
Iron
Iron
Copper
Copper
Zinc
Zinc
Phosphorus
Phosphorus
Sodium
Sodium
Manganese
Manganese
Selenium
Selenium
49%
18%
16%
65%
53%
34%
81%
61%
183%
62%
Vitamin Comparison
Vitamin comparison score is based on the number of vitamins by which one or the other food is richer. The "coverage" charts below show how much of the daily needs can be covered by 300 grams of the food.
6
100 g
300 g
1 oz - 28.35g 1 muffin - 51g 1 piece - 60g
Vitamin C
Vit. C
Vitamin D
Vit. D
Vitamin A
Vit. A
Vitamin E
Vit. E
Vitamin B1
Vit. B1
Vitamin B2
Vit. B2
Vitamin B3
Vit. B3
Vitamin B5
Vit. B5
Vitamin B6
Vit. B6
Vitamin B12
Vit. B12
Vitamin K
Vit. K
Folate
Folate
0.33%
0%
12%
10%
48%
40%
38%
35%
20%
29%
9.3%
41%
3
100 g
300 g
1 piece - 106g
Vitamin C
Vit. C
Vitamin D
Vit. D
Vitamin A
Vit. A
Vitamin E
Vit. E
Vitamin B1
Vit. B1
Vitamin B2
Vit. B2
Vitamin B3
Vit. B3
Vitamin B5
Vit. B5
Vitamin B6
Vit. B6
Vitamin B12
Vit. B12
Vitamin K
Vit. K
Folate
Folate
0%
0%
0.67%
26%
44%
42%
67%
0%
30%
0%
8.3%
12%
All nutrients comparison - raw data values
Nutrient
DV% diff.
Manganese
0.222mg
1.4mg
51%
Phosphorus
391mg
188mg
29%
Cholesterol
57mg
1mg
19%
Magnesium
17mg
68mg
12%
Vitamin B5
0.579mg
12%
Fiber
2.3g
4.8g
10%
Vitamin B3
2.004mg
3.58mg
10%
Vitamin B12
0.23µg
0µg
10%
Folate
55µg
16µg
10%
Copper
0.073mg
0.158mg
9%
Choline
58.7mg
10.1mg
9%
Calcium
135mg
59mg
8%
Protein
6.59g
10.2g
7%
Sodium
599mg
467mg
6%
Zinc
0.67mg
1.24mg
5%
Vitamin E
0.51mg
1.32mg
5%
Selenium
8.7µg
11.4µg
5%
Polyunsaturated fat
1.963g
1.258g
5%
Fats
9.58g
6.7g
4%
Vitamin A
35µg
2µg
4%
Saturated fat
3.732g
2.907g
4%
Monounsaturated fat
3.494g
1.946g
4%
Carbs
54.46g
46.21g
3%
Vitamin B6
0.085mg
0.128mg
3%
Calories
330kcal
286kcal
2%
Potassium
133mg
185mg
2%
Iron
1.85mg
1.73mg
2%
Vitamin B1
0.19mg
0.176mg
1%
Fructose
0.2g
0.8g
1%
Protein per 100 calories
2g
3.6g
N/A
Calories per 10 g protein
501kcal
280kcal
N/A
Weight per 100 calories
30g
35g
N/A
Unsaturated / Saturated Fat ratio
1.5
1.1
N/A
Vitamin C
0.1mg
0mg
0%
Net carbs
52.16g
41.41g
N/A
Sugar
16.05g
3.4g
N/A
Starch
35.66g
36g
0%
Vitamin B2
0.175mg
0.18mg
0%
Vitamin K
3.7µg
3.3µg
0%
Trans fat
0.224g
N/A
Tryptophan
0.059mg
0%
Threonine
0.226mg
0%
Isoleucine
0.265mg
0%
Leucine
0.658mg
0%
Lysine
0.324mg
0%
Methionine
0.157mg
0%
Phenylalanine
0.343mg
0%
Valine
0.334mg
0%
Histidine
0.167mg
0%
Omega-3 - DHA
0.007g
0g
N/A
Omega-3 - ALA
0.076g
N/A
Omega-3 - DPA
0.003g
0g
N/A
Omega-3 - Eicosatrienoic acid
0.004g
N/A
Omega-6 - Gamma-linoleic acid
0.004g
N/A
Omega-6 - Dihomo-gamma-linoleic acid
0.009g
N/A
Omega-6 - Eicosadienoic acid
0.043g
N/A
Omega-6 - Linoleic acid
1.726g
N/A
Macronutrient Comparison
Macronutrient breakdown side-by-side comparison
3
7%
10%
54%
27%
2%
Protein:
6.59 g
Fats:
9.58 g
Carbs:
54.46 g
Water:
27.11 g
Other:
2.26 g
2
10%
7%
46%
35%
2%
Protein:
10.2 g
Fats:
6.7 g
Carbs:
46.21 g
Water:
34.9 g
Other:
1.99 g
Contains
more
Fats Fats
+43%
Contains
more
Carbs Carbs
+17.9%
Contains
more
Other Other
+13.6%
Contains
more
Protein Protein
+54.8%
Contains
more
Water Water
+28.7%
Fat Type Comparison
Fat type breakdown side-by-side comparison
2
41%
38%
21%
Saturated fat:
Sat. Fat
3.732 g
Monounsaturated fat:
Mono. Fat
3.494 g
Polyunsaturated fat:
Poly. Fat
1.963 g
1
48%
32%
21%
Saturated fat:
Sat. Fat
2.907 g
Monounsaturated fat:
Mono. Fat
1.946 g
Polyunsaturated fat:
Poly. Fat
1.258 g
Contains
more
Mono. Fat Monounsaturated fat
+79.5%
Contains
more
Poly. Fat Polyunsaturated fat
+56%
Contains
less
Sat. Fat Saturated fat
-22.1%
Carbohydrate type comparison
Carbohydrate type breakdown side-by-side comparison
2
69%
28%
2%
Starch:
35.66 g
Sucrose:
14.45 g
Glucose:
0.29 g
Fructose:
0.2 g
Lactose:
1.05 g
Maltose:
0.06 g
Galactose:
0 g
4
91%
2%
4%
Starch:
36 g
Sucrose:
0 g
Glucose:
0.6 g
Fructose:
0.8 g
Lactose:
0.5 g
Maltose:
1.5 g
Galactose:
0 g
Contains
more
Sucrose Sucrose
+∞%
Contains
more
Lactose Lactose
+110%
Contains
more
Glucose Glucose
+106.9%
Contains
more
Fructose Fructose
+300%
Contains
more
Maltose Maltose
+2400%
~equal in
Starch
~36g
~equal in
Galactose
~0g