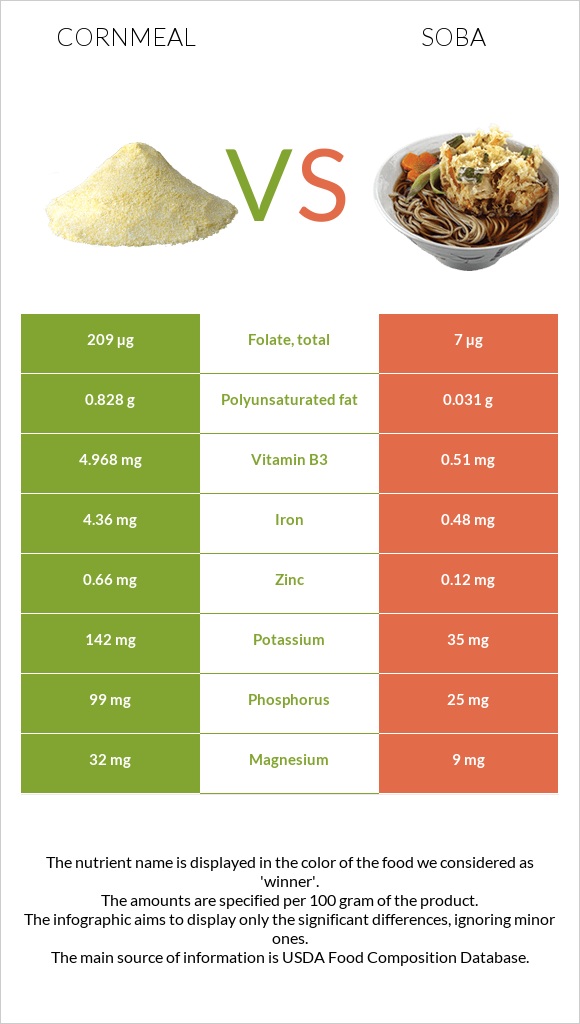
What are the differences between cornmeal and soba? Cornmeal is higher in folate, iron, vitamin B1, vitamin B3, vitamin B2, vitamin B6, phosphorus, copper, and magnesium, yet soba is higher in manganese. Cornmeal's daily need coverage for folate is 51% more. Cornmeal has 15 times more vitamin B2 than soba. While cornmeal has 0.382mg of vitamin B2, soba has only 0.026mg. The glycemic index of soba is lower. We used Cornmeal, degermed, enriched, yellow and Noodles, japanese, soba, cooked types in this article.
Infographic
Mineral Comparison
Mineral comparison score is based on the number of minerals by which one or the other food is richer. The "coverage" charts below show how much of the daily needs can be covered by 300 grams of the food.
8
100 g
300 g
1 cup - 157g
Magnesium
Magnesium
Calcium
Calcium
Potassium
Potassium
Iron
Iron
Copper
Copper
Zinc
Zinc
Phosphorus
Phosphorus
Sodium
Sodium
Manganese
Manganese
Selenium
Selenium
23%
0.9%
13%
164%
25%
18%
42%
0.91%
23%
57%
2
100 g
300 g
1 cup - 114g
Magnesium
Magnesium
Calcium
Calcium
Potassium
Potassium
Iron
Iron
Copper
Copper
Zinc
Zinc
Phosphorus
Phosphorus
Sodium
Sodium
Manganese
Manganese
Selenium
Selenium
6.4%
1.2%
3.1%
18%
2.7%
3.3%
11%
7.8%
49%
0%
Vitamin Comparison
Vitamin comparison score is based on the number of vitamins by which one or the other food is richer. The "coverage" charts below show how much of the daily needs can be covered by 300 grams of the food.
7
100 g
300 g
1 cup - 157g
Vitamin C
Vit. C
Vitamin D
Vit. D
Vitamin A
Vit. A
Vitamin E
Vit. E
Vitamin B1
Vit. B1
Vitamin B2
Vit. B2
Vitamin B3
Vit. B3
Vitamin B5
Vit. B5
Vitamin B6
Vit. B6
Vitamin B12
Vit. B12
Vitamin K
Vit. K
Folate
Folate
0%
0%
3.7%
2.4%
138%
88%
93%
14%
42%
0%
0%
157%
0
100 g
300 g
1 cup - 114g
Vitamin C
Vit. C
Vitamin D
Vit. D
Vitamin A
Vit. A
Vitamin E
Vit. E
Vitamin B1
Vit. B1
Vitamin B2
Vit. B2
Vitamin B3
Vit. B3
Vitamin B5
Vit. B5
Vitamin B6
Vit. B6
Vitamin B12
Vit. B12
Vitamin K
Vit. K
Folate
Folate
0%
0%
0%
0%
24%
6%
9.6%
14%
9.2%
0%
0%
5.3%
All nutrients comparison - raw data values
Nutrient
DV% diff.
Folate
209µg
7µg
51%
Iron
4.36mg
0.48mg
49%
Vitamin B1
0.551mg
0.094mg
38%
Starch
73.3g
30%
Vitamin B3
4.968mg
0.51mg
28%
Vitamin B2
0.382mg
0.026mg
27%
Carbs
79.45g
21.44g
19%
Selenium
10.5µg
19%
Fiber
3.9g
16%
Calories
370kcal
99kcal
14%
Phosphorus
99mg
25mg
11%
Vitamin B6
0.182mg
0.04mg
11%
Manganese
0.174mg
0.374mg
9%
Copper
0.076mg
0.008mg
8%
Magnesium
32mg
9mg
5%
Zinc
0.66mg
0.12mg
5%
Polyunsaturated fat
0.828g
0.031g
5%
Protein
7.11g
5.06g
4%
Fats
1.75g
0.1g
3%
Potassium
142mg
35mg
3%
Sodium
7mg
60mg
2%
Choline
8.6mg
2%
Vitamin A
11µg
0µg
1%
Vitamin E
0.12mg
1%
Saturated fat
0.22g
0.019g
1%
Monounsaturated fat
0.39g
0.026g
1%
Protein per 100 calories
1.9g
5.1g
N/A
Calories per 10 g protein
520kcal
196kcal
N/A
Weight per 100 calories
27g
101g
N/A
Net carbs
75.55g
21.44g
N/A
Calcium
3mg
4mg
0%
Sugar
1.61g
N/A
Vitamin B5
0.24mg
0.235mg
0%
Tryptophan
0.038mg
0.072mg
0%
Threonine
0.172mg
0.177mg
0%
Isoleucine
0.242mg
0.195mg
0%
Leucine
1.006mg
0.33mg
0%
Lysine
0.105mg
0.214mg
0%
Methionine
0.162mg
0.072mg
0%
Phenylalanine
0.366mg
0.217mg
0%
Valine
0.337mg
0.249mg
0%
Histidine
0.172mg
0.119mg
0%
Fructose
0.17g
0%
Macronutrient Comparison
Macronutrient breakdown side-by-side comparison
4
7%
2%
79%
11%
Protein:
7.11 g
Fats:
1.75 g
Carbs:
79.45 g
Water:
11.18 g
Other:
0.51 g
1
5%
21%
73%
Protein:
5.06 g
Fats:
0.1 g
Carbs:
21.44 g
Water:
73.01 g
Other:
0.39 g
Contains
more
Protein Protein
+40.5%
Contains
more
Fats Fats
+1650%
Contains
more
Carbs Carbs
+270.6%
Contains
more
Other Other
+30.8%
Contains
more
Water Water
+553%
Fat Type Comparison
Fat type breakdown side-by-side comparison
2
15%
27%
58%
Saturated fat:
Sat. Fat
0.22 g
Monounsaturated fat:
Mono. Fat
0.39 g
Polyunsaturated fat:
Poly. Fat
0.828 g
1
25%
34%
41%
Saturated fat:
Sat. Fat
0.019 g
Monounsaturated fat:
Mono. Fat
0.026 g
Polyunsaturated fat:
Poly. Fat
0.031 g
Contains
more
Mono. Fat Monounsaturated fat
+1400%
Contains
more
Poly. Fat Polyunsaturated fat
+2571%
Contains
less
Sat. Fat Saturated fat
-91.4%