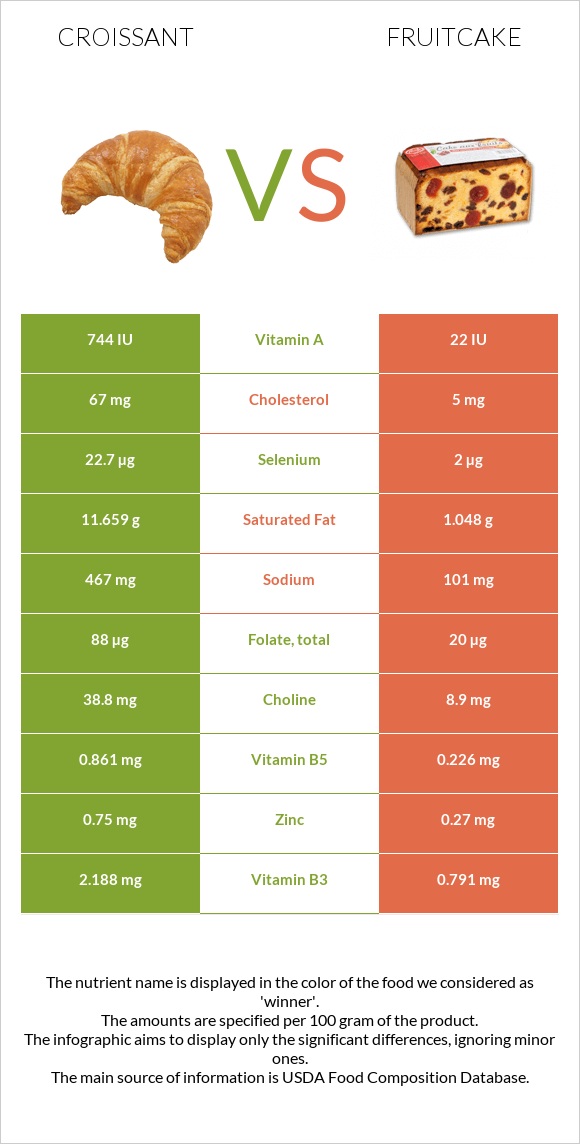
How are croissant and fruitcake different? Croissant has more selenium, vitamin B1, folate, vitamin A, vitamin B5, vitamin B2, and vitamin B3 than fruitcake. Daily need coverage for saturated fat for croissant is 53% higher. Croissant contains 34 times more vitamin A than fruitcake. While croissant contains 744 IU of vitamin A, fruitcake contains only 22 IU. Fruitcake has less cholesterol. Croissants, butter and Cake, fruitcake, commercially prepared are the varieties used in this article.
Infographic
Mineral Comparison
Mineral comparison score is based on the number of minerals by which one or the other food is richer. The "coverage" charts below show how much of the daily needs can be covered by 300 grams of the food.
6
100 g
300 g
1 croissant, mini - 28g 1 oz - 28.35g 1 croissant, small - 42g 1 croissant, medium - 57g 1 croissant, large - 67g
Magnesium
Magnesium
Calcium
Calcium
Potassium
Potassium
Iron
Iron
Copper
Copper
Zinc
Zinc
Phosphorus
Phosphorus
Sodium
Sodium
Manganese
Manganese
Selenium
Selenium
11%
11%
10%
76%
27%
20%
45%
61%
43%
124%
2
100 g
300 g
1 oz - 28.35g 1 piece - 43g
Magnesium
Magnesium
Calcium
Calcium
Potassium
Potassium
Iron
Iron
Copper
Copper
Zinc
Zinc
Phosphorus
Phosphorus
Sodium
Sodium
Manganese
Manganese
Selenium
Selenium
11%
9.9%
14%
78%
17%
7.4%
22%
13%
29%
11%
Vitamin Comparison
Vitamin comparison score is based on the number of vitamins by which one or the other food is richer. The "coverage" charts below show how much of the daily needs can be covered by 300 grams of the food.
9
100 g
300 g
1 croissant, mini - 28g 1 oz - 28.35g 1 croissant, small - 42g 1 croissant, medium - 57g 1 croissant, large - 67g
Vitamin C
Vit. C
Vitamin D
Vit. D
Vitamin A
Vit. A
Vitamin E
Vit. E
Vitamin B1
Vit. B1
Vitamin B2
Vit. B2
Vitamin B3
Vit. B3
Vitamin B5
Vit. B5
Vitamin B6
Vit. B6
Vitamin B12
Vit. B12
Vitamin K
Vit. K
Folate
Folate
0.67%
0%
69%
17%
97%
56%
41%
52%
13%
20%
4.5%
66%
1
100 g
300 g
1 oz - 28.35g 1 piece - 43g
Vitamin C
Vit. C
Vitamin D
Vit. D
Vitamin A
Vit. A
Vitamin E
Vit. E
Vitamin B1
Vit. B1
Vitamin B2
Vit. B2
Vitamin B3
Vit. B3
Vitamin B5
Vit. B5
Vitamin B6
Vit. B6
Vitamin B12
Vit. B12
Vitamin K
Vit. K
Folate
Folate
1.7%
0%
2.3%
18%
13%
23%
15%
14%
11%
1.3%
3.8%
15%
All nutrients comparison - raw data values
Nutrient
DV% diff.
Saturated fat
11.659g
1.048g
48%
Selenium
22.7µg
2µg
38%
Vitamin B1
0.388mg
0.05mg
28%
Vitamin A
206µg
7µg
22%
Cholesterol
67mg
5mg
21%
Fats
21g
9.1g
18%
Folate
88µg
20µg
17%
Sodium
467mg
101mg
16%
Polyunsaturated fat
1.094g
3.323g
15%
Vitamin B5
0.861mg
0.226mg
13%
Protein
8.2g
2.9g
11%
Vitamin B2
0.241mg
0.099mg
11%
Vitamin B3
2.188mg
0.791mg
9%
Phosphorus
105mg
52mg
8%
Vitamin B12
0.16µg
0.01µg
6%
Carbs
45.8g
61.6g
5%
Manganese
0.33mg
0.22mg
5%
Choline
38.8mg
8.9mg
5%
Calories
406kcal
324kcal
4%
Fiber
2.6g
3.7g
4%
Zinc
0.75mg
0.27mg
4%
Copper
0.08mg
0.05mg
3%
Monounsaturated fat
5.525g
4.2g
3%
Potassium
118mg
153mg
1%
Iron
2.03mg
2.07mg
1%
Vitamin B6
0.058mg
0.046mg
1%
Protein per 100 calories
2g
0.9g
N/A
Calories per 10 g protein
495kcal
1117kcal
N/A
Weight per 100 calories
25g
31g
N/A
Unsaturated / Saturated Fat ratio
0.57
7.2
N/A
Vitamin C
0.2mg
0.5mg
0%
Net carbs
43.2g
57.9g
N/A
Magnesium
16mg
16mg
0%
Calcium
37mg
33mg
0%
Sugar
11.26g
27.42g
N/A
Vitamin E
0.84mg
0.9mg
0%
Vitamin K
1.8µg
1.5µg
0%
Tryptophan
0.099mg
0.042mg
0%
Threonine
0.284mg
0.102mg
0%
Isoleucine
0.365mg
0.121mg
0%
Leucine
0.623mg
0.206mg
0%
Lysine
0.329mg
0.121mg
0%
Methionine
0.175mg
0.059mg
0%
Phenylalanine
0.416mg
0.14mg
0%
Valine
0.41mg
0.144mg
0%
Histidine
0.187mg
0.071mg
0%
Omega-3 - EPA
0.003g
0g
N/A
Omega-3 - DHA
0.002g
0.001g
N/A
Macronutrient Comparison
Macronutrient breakdown side-by-side comparison
3
8%
21%
46%
23%
2%
Protein:
8.2 g
Fats:
21 g
Carbs:
45.8 g
Water:
23.2 g
Other:
1.8 g
2
3%
9%
62%
25%
Protein:
2.9 g
Fats:
9.1 g
Carbs:
61.6 g
Water:
25.3 g
Other:
1.1 g
Contains
more
Protein Protein
+182.8%
Contains
more
Fats Fats
+130.8%
Contains
more
Other Other
+63.6%
Contains
more
Carbs Carbs
+34.5%
Fat Type Comparison
Fat type breakdown side-by-side comparison
1
64%
30%
6%
Saturated fat:
Sat. Fat
11.659 g
Monounsaturated fat:
Mono. Fat
5.525 g
Polyunsaturated fat:
Poly. Fat
1.094 g
2
12%
49%
39%
Saturated fat:
Sat. Fat
1.048 g
Monounsaturated fat:
Mono. Fat
4.2 g
Polyunsaturated fat:
Poly. Fat
3.323 g
Contains
more
Mono. Fat Monounsaturated fat
+31.5%
Contains
less
Sat. Fat Saturated fat
-91%
Contains
more
Poly. Fat Polyunsaturated fat
+203.7%