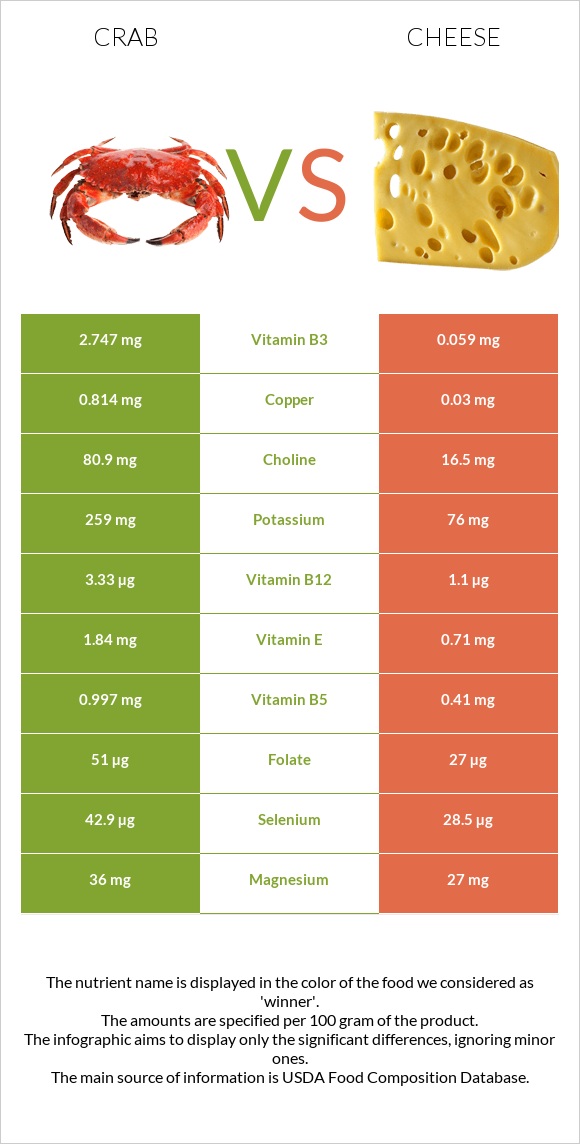
Significant differences between crab and cheese Crab has more vitamin B12, copper, selenium, vitamin B3, and vitamin B5; however, cheese is richer in calcium, phosphorus, vitamin B2, and vitamin A. Cheese covers your daily saturated fat needs 93% more than crab. Cheese has 47 times less vitamin B3 than crab. Crab has 2.747mg of vitamin B3, while cheese has 0.059mg. Crab contains less saturated fat. Specific food types used in this comparison are Crustaceans, crab, blue, canned and Cheese, cheddar .
Infographic
Mineral Comparison
Mineral comparison score is based on the number of minerals by which one or the other food is richer. The "coverage" charts below show how much of the daily needs can be covered by 300 grams of the food.
7
100 g
300 g
1 oz - 28.35g 3 oz - 85g 1 can (6.5 oz), drained - 125g 1 cup - 135g
Magnesium
Magnesium
Calcium
Calcium
Potassium
Potassium
Iron
Iron
Copper
Copper
Zinc
Zinc
Phosphorus
Phosphorus
Sodium
Sodium
Manganese
Manganese
Selenium
Selenium
26%
27%
23%
19%
271%
104%
100%
73%
9.7%
234%
2
100 g
300 g
1 cubic inch - 17g 1 slice (1 oz) - 28g 1 oz - 28.35g 1 cup, shredded - 113g 1 cup, diced - 132g 1 cup, melted - 244g
Magnesium
Magnesium
Calcium
Calcium
Potassium
Potassium
Iron
Iron
Copper
Copper
Zinc
Zinc
Phosphorus
Phosphorus
Sodium
Sodium
Manganese
Manganese
Selenium
Selenium
19%
213%
6.7%
5.3%
10%
99%
195%
85%
3.5%
155%
Vitamin Comparison
Vitamin comparison score is based on the number of vitamins by which one or the other food is richer. The "coverage" charts below show how much of the daily needs can be covered by 300 grams of the food.
7
100 g
300 g
1 oz - 28.35g 3 oz - 85g 1 can (6.5 oz), drained - 125g 1 cup - 135g
Vitamin C
Vit. C
Vitamin D
Vit. D
Vitamin A
Vit. A
Vitamin E
Vit. E
Vitamin B1
Vit. B1
Vitamin B2
Vit. B2
Vitamin B3
Vit. B3
Vitamin B5
Vit. B5
Vitamin B6
Vit. B6
Vitamin B12
Vit. B12
Vitamin K
Vit. K
Folate
Folate
11%
0%
0.33%
37%
5.8%
21%
52%
60%
36%
416%
0.75%
38%
5
100 g
300 g
1 cubic inch - 17g 1 slice (1 oz) - 28g 1 oz - 28.35g 1 cup, shredded - 113g 1 cup, diced - 132g 1 cup, melted - 244g
Vitamin C
Vit. C
Vitamin D
Vit. D
Vitamin A
Vit. A
Vitamin E
Vit. E
Vitamin B1
Vit. B1
Vitamin B2
Vit. B2
Vitamin B3
Vit. B3
Vitamin B5
Vit. B5
Vitamin B6
Vit. B6
Vitamin B12
Vit. B12
Vitamin K
Vit. K
Folate
Folate
0%
9%
110%
14%
7.3%
99%
1.1%
25%
15%
138%
6%
20%
All nutrients comparison - raw data values
Nutrient
DV% diff.
Vitamin B12
3.33µg
1.1µg
93%
Copper
0.814mg
0.03mg
87%
Saturated fat
0.201g
18.867g
85%
Calcium
91mg
710mg
62%
Fats
0.74g
33.31g
50%
Vitamin A
1µg
330µg
37%
Phosphorus
234mg
455mg
32%
Selenium
42.9µg
28.5µg
26%
Vitamin B2
0.093mg
0.428mg
26%
Monounsaturated fat
0.129g
9.246g
23%
Vitamin B3
2.747mg
0.059mg
17%
Calories
83kcal
404kcal
16%
Vitamin B5
0.997mg
0.41mg
12%
Choline
80.9mg
16.5mg
12%
Protein
17.88g
22.87g
10%
Vitamin E
1.84mg
0.71mg
8%
Polyunsaturated fat
0.258g
1.421g
8%
Vitamin B6
0.156mg
0.066mg
7%
Folate
51µg
27µg
6%
Potassium
259mg
76mg
5%
Iron
0.5mg
0.14mg
5%
Vitamin C
3.3mg
0mg
4%
Sodium
563mg
653mg
4%
Vitamin D*
0 IU
24 IU
3%
Vitamin D
0µg
0.6µg
3%
Magnesium
36mg
27mg
2%
Zinc
3.81mg
3.64mg
2%
Manganese
0.074mg
0.027mg
2%
Vitamin K
0.3µg
2.4µg
2%
Carbs
0g
3.09g
1%
Cholesterol
97mg
99mg
1%
Vitamin B1
0.023mg
0.029mg
1%
Protein per 100 calories
22g
5.7g
N/A
Calories per 10 g protein
46kcal
177kcal
N/A
Weight per 100 calories
120g
25g
N/A
Unsaturated / Saturated Fat ratio
1.9
0.57
N/A
Net carbs
0g
3.09g
N/A
Sugar
0g
0.48g
N/A
Trans fat
0.014g
0.917g
N/A
Tryptophan
0.226mg
0.547mg
0%
Threonine
0.727mg
1.044mg
0%
Isoleucine
0.776mg
1.206mg
0%
Leucine
1.307mg
1.939mg
0%
Lysine
1.386mg
1.025mg
0%
Methionine
0.452mg
0.547mg
0%
Phenylalanine
0.708mg
1.074mg
0%
Valine
0.806mg
1.404mg
0%
Histidine
0.393mg
0.547mg
0%
Omega-3 - EPA
0.101g
0.01g
N/A
Omega-3 - DHA
0.067g
0.001g
N/A
Omega-3 - DPA
0.009g
0.017g
N/A
Omega-6 - Eicosadienoic acid
0.005g
0.007g
N/A
Macronutrient Comparison
Macronutrient breakdown side-by-side comparison
1
18%
80%
2%
Protein:
17.88 g
Fats:
0.74 g
Carbs:
0 g
Water:
79.69 g
Other:
1.69 g
4
23%
33%
3%
37%
4%
Protein:
22.87 g
Fats:
33.31 g
Carbs:
3.09 g
Water:
37.02 g
Other:
3.71 g
Contains
more
Water Water
+115.3%
Contains
more
Protein Protein
+27.9%
Contains
more
Fats Fats
+4401.4%
Contains
more
Carbs Carbs
+∞%
Contains
more
Other Other
+119.5%
Fat Type Comparison
Fat type breakdown side-by-side comparison
1
34%
22%
44%
Saturated fat:
Sat. Fat
0.201 g
Monounsaturated fat:
Mono. Fat
0.129 g
Polyunsaturated fat:
Poly. Fat
0.258 g
2
64%
31%
5%
Saturated fat:
Sat. Fat
18.867 g
Monounsaturated fat:
Mono. Fat
9.246 g
Polyunsaturated fat:
Poly. Fat
1.421 g
Contains
less
Sat. Fat Saturated fat
-98.9%
Contains
more
Mono. Fat Monounsaturated fat
+7067.4%
Contains
more
Poly. Fat Polyunsaturated fat
+450.8%