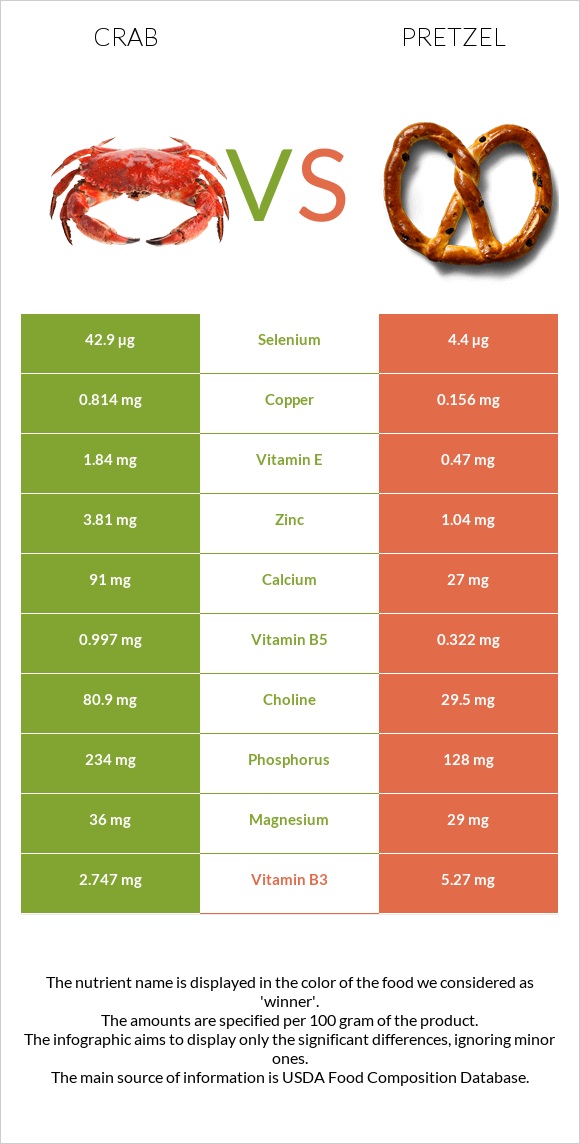
How are crab and pretzel different? Crab is richer in vitamin B12, copper, selenium, and zinc, while pretzel is higher in iron, manganese, vitamin B1, and folate. Crab covers your daily need for vitamin B12, 139% more than pretzel. Pretzel has a higher glycemic index (83) than crab (0). Crustaceans, crab, blue, canned and Snacks, pretzels, hard, plain, salted types were used in this article.
Infographic
Mineral Comparison
Mineral comparison score is based on the number of minerals by which one or the other food is richer. The "coverage" charts below show how much of the daily needs can be covered by 300 grams of the food.
8
100 g
300 g
1 oz - 28.35g 3 oz - 85g 1 can (6.5 oz), drained - 125g 1 cup - 135g
Magnesium
Magnesium
Calcium
Calcium
Potassium
Potassium
Iron
Iron
Copper
Copper
Zinc
Zinc
Phosphorus
Phosphorus
Sodium
Sodium
Manganese
Manganese
Selenium
Selenium
26%
27%
23%
19%
271%
104%
100%
73%
9.7%
234%
2
100 g
300 g
1 oz - 28.35g 10 twists - 60g
Magnesium
Magnesium
Calcium
Calcium
Potassium
Potassium
Iron
Iron
Copper
Copper
Zinc
Zinc
Phosphorus
Phosphorus
Sodium
Sodium
Manganese
Manganese
Selenium
Selenium
21%
8.1%
20%
172%
52%
28%
55%
162%
132%
24%
Vitamin Comparison
Vitamin comparison score is based on the number of vitamins by which one or the other food is richer. The "coverage" charts below show how much of the daily needs can be covered by 300 grams of the food.
6
100 g
300 g
1 oz - 28.35g 3 oz - 85g 1 can (6.5 oz), drained - 125g 1 cup - 135g
Vitamin C
Vit. C
Vitamin D
Vit. D
Vitamin A
Vit. A
Vitamin E
Vit. E
Vitamin B1
Vit. B1
Vitamin B2
Vit. B2
Vitamin B3
Vit. B3
Vitamin B5
Vit. B5
Vitamin B6
Vit. B6
Vitamin B12
Vit. B12
Vitamin K
Vit. K
Folate
Folate
11%
0%
0.33%
37%
5.8%
21%
52%
60%
36%
416%
0.75%
38%
5
100 g
300 g
1 oz - 28.35g 10 twists - 60g
Vitamin C
Vit. C
Vitamin D
Vit. D
Vitamin A
Vit. A
Vitamin E
Vit. E
Vitamin B1
Vit. B1
Vitamin B2
Vit. B2
Vitamin B3
Vit. B3
Vitamin B5
Vit. B5
Vitamin B6
Vit. B6
Vitamin B12
Vit. B12
Vitamin K
Vit. K
Folate
Folate
7%
0%
0%
9.4%
106%
77%
99%
19%
17%
0%
7%
125%
All nutrients comparison - raw data values
Nutrient
DV% diff.
Vitamin B12
3.33µg
0µg
139%
Copper
0.814mg
0.156mg
73%
Selenium
42.9µg
4.4µg
70%
Iron
0.5mg
4.58mg
51%
Manganese
0.074mg
1.015mg
41%
Vitamin B1
0.023mg
0.424mg
33%
Cholesterol
97mg
0mg
32%
Starch
0g
72.58g
30%
Sodium
563mg
1240mg
29%
Folate
51µg
166µg
29%
Carbs
0g
80.39g
27%
Zinc
3.81mg
1.04mg
25%
Vitamin B2
0.093mg
0.332mg
18%
Protein
17.88g
10.04g
16%
Vitamin B3
2.747mg
5.27mg
16%
Calories
83kcal
384kcal
15%
Phosphorus
234mg
128mg
15%
Fiber
0g
3.4g
14%
Vitamin B5
0.997mg
0.322mg
14%
Vitamin E
1.84mg
0.47mg
9%
Choline
80.9mg
29.5mg
9%
Polyunsaturated fat
0.258g
1.291g
7%
Calcium
91mg
27mg
6%
Vitamin B6
0.156mg
0.074mg
6%
Fats
0.74g
2.93g
3%
Magnesium
36mg
29mg
2%
Vitamin K
0.3µg
2.8µg
2%
Vitamin C
3.3mg
2.1mg
1%
Potassium
259mg
223mg
1%
Saturated fat
0.201g
0.391g
1%
Monounsaturated fat
0.129g
0.727g
1%
Protein per 100 calories
22g
2.6g
N/A
Calories per 10 g protein
46kcal
382kcal
N/A
Weight per 100 calories
120g
26g
N/A
Unsaturated / Saturated Fat ratio
1.9
5.2
N/A
Net carbs
0g
76.99g
N/A
Sugar
0g
2.21g
N/A
Vitamin A
1µg
0µg
0%
Trans fat
0.014g
0.004g
N/A
Tryptophan
0.226mg
0.097mg
0%
Threonine
0.727mg
0.25mg
0%
Isoleucine
0.776mg
0.407mg
0%
Leucine
1.307mg
0.757mg
0%
Lysine
1.386mg
0.257mg
0%
Methionine
0.452mg
0.177mg
0%
Phenylalanine
0.708mg
0.52mg
0%
Valine
0.806mg
0.48mg
0%
Histidine
0.393mg
0.22mg
0%
Fructose
0g
0.31g
0%
Omega-3 - EPA
0.101g
0g
N/A
Omega-3 - DHA
0.067g
0g
N/A
Omega-3 - ALA
0.063g
N/A
Omega-3 - DPA
0.009g
0g
N/A
Omega-6 - Gamma-linoleic acid
0.001g
N/A
Omega-6 - Eicosadienoic acid
0.005g
0g
N/A
Omega-6 - Linoleic acid
1.223g
N/A
Macronutrient Comparison
Macronutrient breakdown side-by-side comparison
2
18%
80%
2%
Protein:
17.88 g
Fats:
0.74 g
Carbs:
0 g
Water:
79.69 g
Other:
1.69 g
3
10%
3%
80%
3%
4%
Protein:
10.04 g
Fats:
2.93 g
Carbs:
80.39 g
Water:
3.13 g
Other:
3.51 g
Contains
more
Protein Protein
+78.1%
Contains
more
Water Water
+2446%
Contains
more
Fats Fats
+295.9%
Contains
more
Carbs Carbs
+∞%
Contains
more
Other Other
+107.7%
Fat Type Comparison
Fat type breakdown side-by-side comparison
1
34%
22%
44%
Saturated fat:
Sat. Fat
0.201 g
Monounsaturated fat:
Mono. Fat
0.129 g
Polyunsaturated fat:
Poly. Fat
0.258 g
2
16%
30%
54%
Saturated fat:
Sat. Fat
0.391 g
Monounsaturated fat:
Mono. Fat
0.727 g
Polyunsaturated fat:
Poly. Fat
1.291 g
Contains
less
Sat. Fat Saturated fat
-48.6%
Contains
more
Mono. Fat Monounsaturated fat
+463.6%
Contains
more
Poly. Fat Polyunsaturated fat
+400.4%