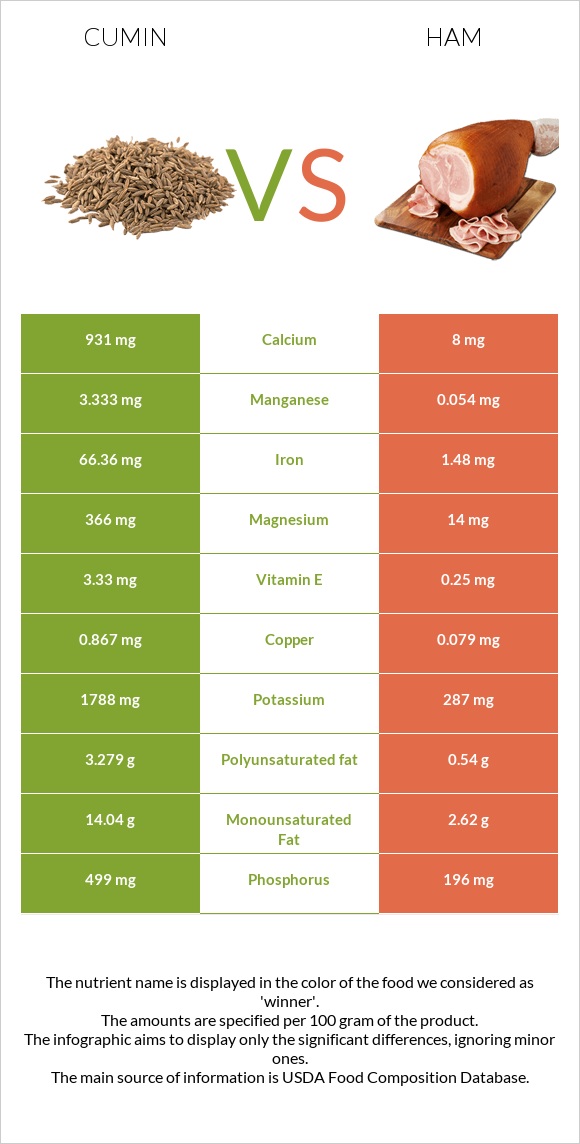
How are cumin and ham different? Cumin is richer in iron, manganese, calcium, copper, magnesium, potassium, phosphorus, and fiber, while ham is higher in vitamin B12. Cumin covers your daily need for iron, 811% more than ham. Cumin is lower in sodium. Spices, cumin seed and Pork, cured, ham, boneless, extra lean (approximately 5% fat), roasted types were used in this article.
Infographic
Mineral Comparison
Mineral comparison score is based on the number of minerals by which one or the other food is richer. The "coverage" charts below show how much of the daily needs can be covered by 300 grams of the food.
9
100 g
300 g
0.25 tsp, whole - 0.5g 1 tbsp, whole - 6g
Magnesium
Magnesium
Calcium
Calcium
Potassium
Potassium
Iron
Iron
Copper
Copper
Zinc
Zinc
Phosphorus
Phosphorus
Sodium
Sodium
Manganese
Manganese
Selenium
Selenium
261%
279%
158%
2489%
289%
131%
214%
22%
435%
28%
1
100 g
300 g
3 oz - 85g 1 cup - 140g
Magnesium
Magnesium
Calcium
Calcium
Potassium
Potassium
Iron
Iron
Copper
Copper
Zinc
Zinc
Phosphorus
Phosphorus
Sodium
Sodium
Manganese
Manganese
Selenium
Selenium
10%
2.4%
25%
56%
26%
79%
84%
157%
7%
106%
Vitamin Comparison
Vitamin comparison score is based on the number of vitamins by which one or the other food is richer. The "coverage" charts below show how much of the daily needs can be covered by 300 grams of the food.
7
100 g
300 g
0.25 tsp, whole - 0.5g 1 tbsp, whole - 6g
Vitamin C
Vit. C
Vitamin D
Vit. D
Vitamin A
Vit. A
Vitamin E
Vit. E
Vitamin B1
Vit. B1
Vitamin B2
Vit. B2
Vitamin B3
Vit. B3
Vitamin B5
Vit. B5
Vitamin B6
Vit. B6
Vitamin B12
Vit. B12
Vitamin K
Vit. K
Folate
Folate
26%
0%
21%
67%
157%
75%
86%
0%
100%
0%
14%
7.5%
4
100 g
300 g
3 oz - 85g 1 cup - 140g
Vitamin C
Vit. C
Vitamin D
Vit. D
Vitamin A
Vit. A
Vitamin E
Vit. E
Vitamin B1
Vit. B1
Vitamin B2
Vit. B2
Vitamin B3
Vit. B3
Vitamin B5
Vit. B5
Vitamin B6
Vit. B6
Vitamin B12
Vit. B12
Vitamin K
Vit. K
Folate
Folate
0%
12%
0%
5%
189%
47%
75%
24%
92%
81%
0%
2.3%
All nutrients comparison - raw data values
Nutrient
DV% diff.
Iron
66.36mg
1.48mg
811%
Manganese
3.333mg
0.054mg
143%
Calcium
931mg
8mg
92%
Copper
0.867mg
0.079mg
88%
Magnesium
366mg
14mg
84%
Sodium
168mg
1203mg
45%
Potassium
1788mg
287mg
44%
Phosphorus
499mg
196mg
43%
Fiber
10.5g
0g
42%
Monounsaturated fat
14.04g
2.62g
29%
Vitamin B12
0µg
0.65µg
27%
Fats
22.27g
5.53g
26%
Selenium
5.2µg
19.5µg
26%
Vitamin E
3.33mg
0.25mg
21%
Cholesterol
0mg
53mg
18%
Polyunsaturated fat
3.279g
0.54g
18%
Zinc
4.8mg
2.88mg
17%
Carbs
44.24g
1.5g
14%
Calories
375kcal
145kcal
12%
Vitamin B1
0.628mg
0.754mg
11%
Choline
24.7mg
85.1mg
11%
Vitamin B2
0.327mg
0.202mg
10%
Vitamin C
7.7mg
0mg
9%
Vitamin B5
0.403mg
8%
Vitamin A
64µg
0µg
7%
Protein
17.81g
20.93g
6%
Vitamin K
5.4µg
0µg
5%
Vitamin D*
0 IU
32 IU
4%
Vitamin D
0µg
0.8µg
4%
Vitamin B3
4.579mg
4.023mg
3%
Vitamin B6
0.435mg
0.4mg
3%
Folate
10µg
3µg
2%
Saturated fat
1.535g
1.81g
1%
Protein per 100 calories
4.7g
14g
N/A
Calories per 10 g protein
211kcal
69kcal
N/A
Weight per 100 calories
27g
69g
N/A
Unsaturated / Saturated Fat ratio
11
1.7
N/A
Net carbs
33.74g
1.5g
N/A
Sugar
2.25g
0g
N/A
Tryptophan
0.251mg
0%
Threonine
0.931mg
0%
Isoleucine
0.918mg
0%
Leucine
1.661mg
0%
Lysine
1.775mg
0%
Methionine
0.553mg
0%
Phenylalanine
0.904mg
0%
Valine
0.908mg
0%
Histidine
0.75mg
0%
Macronutrient Comparison
Macronutrient breakdown side-by-side comparison
3
18%
22%
44%
8%
8%
Protein:
17.81 g
Fats:
22.27 g
Carbs:
44.24 g
Water:
8.06 g
Other:
7.62 g
2
21%
6%
68%
4%
Protein:
20.93 g
Fats:
5.53 g
Carbs:
1.5 g
Water:
67.67 g
Other:
4.37 g
Contains
more
Fats Fats
+302.7%
Contains
more
Carbs Carbs
+2849.3%
Contains
more
Other Other
+74.4%
Contains
more
Protein Protein
+17.5%
Contains
more
Water Water
+739.6%
Fat Type Comparison
Fat type breakdown side-by-side comparison
3
8%
74%
17%
Saturated fat:
Sat. Fat
1.535 g
Monounsaturated fat:
Mono. Fat
14.04 g
Polyunsaturated fat:
Poly. Fat
3.279 g
0
36%
53%
11%
Saturated fat:
Sat. Fat
1.81 g
Monounsaturated fat:
Mono. Fat
2.62 g
Polyunsaturated fat:
Poly. Fat
0.54 g
Contains
less
Sat. Fat Saturated fat
-15.2%
Contains
more
Mono. Fat Monounsaturated fat
+435.9%
Contains
more
Poly. Fat Polyunsaturated fat
+507.2%