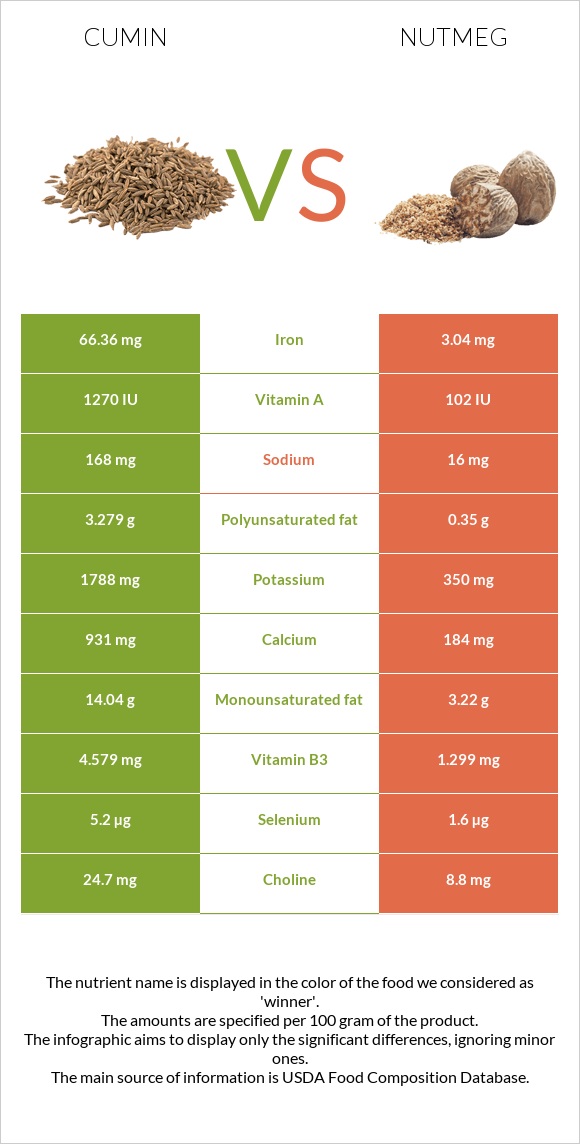
How are cumin and nutmeg different? Cumin is higher in iron, calcium, magnesium, potassium, phosphorus, zinc, vitamin B1, and vitamin A; however, nutmeg is richer in fiber. Daily need coverage for iron for cumin is 792% higher. Cumin contains 12 times more vitamin A than nutmeg. While cumin contains 1270 IU of vitamin A, nutmeg contains only 102 IU. Cumin has less saturated fat. Spices, cumin seed and Spices, nutmeg, ground are the varieties used in this article.
Infographic
Mineral Comparison
Mineral comparison score is based on the number of minerals by which one or the other food is richer. The "coverage" charts below show how much of the daily needs can be covered by 300 grams of the food.
8
100 g
300 g
0.25 tsp, whole - 0.5g 1 tbsp, whole - 6g
Magnesium
Magnesium
Calcium
Calcium
Potassium
Potassium
Iron
Iron
Copper
Copper
Zinc
Zinc
Phosphorus
Phosphorus
Sodium
Sodium
Manganese
Manganese
Selenium
Selenium
261%
279%
158%
2489%
289%
131%
214%
22%
435%
28%
2
100 g
300 g
0.25 tsp - 0.5g 1 tbsp - 7g
Magnesium
Magnesium
Calcium
Calcium
Potassium
Potassium
Iron
Iron
Copper
Copper
Zinc
Zinc
Phosphorus
Phosphorus
Sodium
Sodium
Manganese
Manganese
Selenium
Selenium
131%
55%
31%
114%
342%
59%
91%
2.1%
378%
8.7%
Vitamin Comparison
Vitamin comparison score is based on the number of vitamins by which one or the other food is richer. The "coverage" charts below show how much of the daily needs can be covered by 300 grams of the food.
8
100 g
300 g
0.25 tsp, whole - 0.5g 1 tbsp, whole - 6g
Vitamin C
Vit. C
Vitamin D
Vit. D
Vitamin A
Vit. A
Vitamin E
Vit. E
Vitamin B1
Vit. B1
Vitamin B2
Vit. B2
Vitamin B3
Vit. B3
Vitamin B5
Vit. B5
Vitamin B6
Vit. B6
Vitamin B12
Vit. B12
Vitamin K
Vit. K
Folate
Folate
26%
0%
21%
67%
157%
75%
86%
0%
100%
0%
14%
7.5%
1
100 g
300 g
0.25 tsp - 0.5g 1 tbsp - 7g
Vitamin C
Vit. C
Vitamin D
Vit. D
Vitamin A
Vit. A
Vitamin E
Vit. E
Vitamin B1
Vit. B1
Vitamin B2
Vit. B2
Vitamin B3
Vit. B3
Vitamin B5
Vit. B5
Vitamin B6
Vit. B6
Vitamin B12
Vit. B12
Vitamin K
Vit. K
Folate
Folate
10%
0%
1.7%
0%
87%
13%
24%
0%
37%
0%
0%
57%
All nutrients comparison - raw data values
Nutrient
DV% diff.
Iron
66.36mg
3.04mg
792%
Saturated fat
1.535g
25.94g
111%
Calcium
931mg
184mg
75%
Magnesium
366mg
183mg
44%
Potassium
1788mg
350mg
42%
Fiber
10.5g
20.8g
41%
Phosphorus
499mg
213mg
41%
Monounsaturated fat
14.04g
3.22g
27%
Protein
17.81g
5.84g
24%
Zinc
4.8mg
2.15mg
24%
Vitamin B1
0.628mg
0.346mg
24%
Fats
22.27g
36.31g
22%
Vitamin E
3.33mg
0mg
22%
Vitamin B2
0.327mg
0.057mg
21%
Vitamin B3
4.579mg
1.299mg
21%
Vitamin B6
0.435mg
0.16mg
21%
Polyunsaturated fat
3.279g
0.35g
20%
Manganese
3.333mg
2.9mg
19%
Copper
0.867mg
1.027mg
18%
Folate
10µg
76µg
17%
Calories
375kcal
525kcal
8%
Sodium
168mg
16mg
7%
Vitamin A
64µg
5µg
7%
Selenium
5.2µg
1.6µg
7%
Vitamin C
7.7mg
3mg
5%
Vitamin K
5.4µg
0µg
5%
Choline
24.7mg
8.8mg
3%
Carbs
44.24g
49.29g
2%
Protein per 100 calories
4.7g
1.1g
N/A
Calories per 10 g protein
211kcal
899kcal
N/A
Weight per 100 calories
27g
19g
N/A
Unsaturated / Saturated Fat ratio
11
0.14
N/A
Net carbs
33.74g
28.49g
N/A
Sugar
2.25g
2.99g
N/A
Macronutrient Comparison
Macronutrient breakdown side-by-side comparison
3
18%
22%
44%
8%
8%
Protein:
17.81 g
Fats:
22.27 g
Carbs:
44.24 g
Water:
8.06 g
Other:
7.62 g
2
6%
36%
49%
6%
2%
Protein:
5.84 g
Fats:
36.31 g
Carbs:
49.29 g
Water:
6.23 g
Other:
2.33 g
Contains
more
Protein Protein
+205%
Contains
more
Water Water
+29.4%
Contains
more
Other Other
+227%
Contains
more
Fats Fats
+63%
Contains
more
Carbs Carbs
+11.4%
Fat Type Comparison
Fat type breakdown side-by-side comparison
3
8%
74%
17%
Saturated fat:
Sat. Fat
1.535 g
Monounsaturated fat:
Mono. Fat
14.04 g
Polyunsaturated fat:
Poly. Fat
3.279 g
0
88%
11%
Saturated fat:
Sat. Fat
25.94 g
Monounsaturated fat:
Mono. Fat
3.22 g
Polyunsaturated fat:
Poly. Fat
0.35 g
Contains
less
Sat. Fat Saturated fat
-94.1%
Contains
more
Mono. Fat Monounsaturated fat
+336%
Contains
more
Poly. Fat Polyunsaturated fat
+836.9%