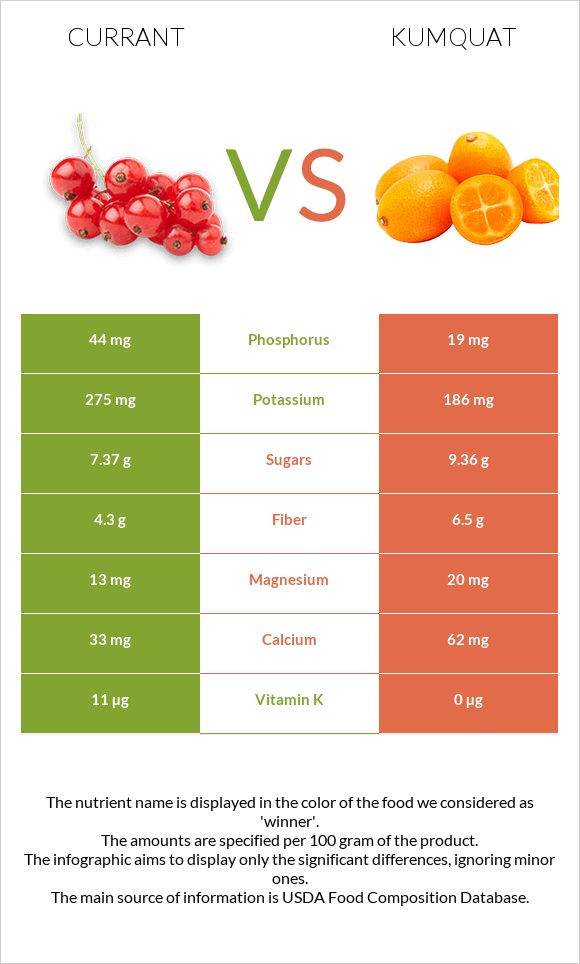
Summary of differences between currants and kumquat Currants have more vitamin K; however, kumquat is higher in fiber. Currants have 2 times more phosphorus than kumquat. While currants have 44mg of phosphorus, kumquat has only 19mg. Currants have less sugar. The glycemic index of kumquat is higher. These are the specific foods used in this comparison Currants, red, and white, raw and Kumquats, raw .
Infographic
Mineral Comparison
Mineral comparison score is based on the number of minerals by which one or the other food is richer. The "coverage" charts below show how much of the daily needs can be covered by 300 grams of the food.
8
100 g
300 g
1 cup - 112g
Magnesium
Magnesium
Calcium
Calcium
Potassium
Potassium
Iron
Iron
Copper
Copper
Zinc
Zinc
Phosphorus
Phosphorus
Sodium
Sodium
Manganese
Manganese
Selenium
Selenium
9.3%
9.9%
24%
38%
36%
6.3%
19%
0.13%
24%
3.3%
2
100 g
300 g
1 fruit without refuse - 19g
Magnesium
Magnesium
Calcium
Calcium
Potassium
Potassium
Iron
Iron
Copper
Copper
Zinc
Zinc
Phosphorus
Phosphorus
Sodium
Sodium
Manganese
Manganese
Selenium
Selenium
14%
19%
16%
32%
32%
4.6%
8.1%
1.3%
18%
0%
Vitamin Comparison
Vitamin comparison score is based on the number of vitamins by which one or the other food is richer. The "coverage" charts below show how much of the daily needs can be covered by 300 grams of the food.
2
100 g
300 g
1 cup - 112g
Vitamin C
Vit. C
Vitamin D
Vit. D
Vitamin A
Vit. A
Vitamin E
Vit. E
Vitamin B1
Vit. B1
Vitamin B2
Vit. B2
Vitamin B3
Vit. B3
Vitamin B5
Vit. B5
Vitamin B6
Vit. B6
Vitamin B12
Vit. B12
Vitamin K
Vit. K
Folate
Folate
137%
0%
0.67%
2%
10%
12%
1.9%
3.8%
16%
0%
28%
6%
6
100 g
300 g
1 fruit without refuse - 19g
Vitamin C
Vit. C
Vitamin D
Vit. D
Vitamin A
Vit. A
Vitamin E
Vit. E
Vitamin B1
Vit. B1
Vitamin B2
Vit. B2
Vitamin B3
Vit. B3
Vitamin B5
Vit. B5
Vitamin B6
Vit. B6
Vitamin B12
Vit. B12
Vitamin K
Vit. K
Folate
Folate
146%
0%
5%
3%
9.3%
21%
8%
12%
8.3%
0%
0%
13%
All nutrients comparison - raw data values
Nutrient
DV% diff.
Fiber
4.3g
6.5g
9%
Vitamin K
11µg
0µg
9%
Phosphorus
44mg
19mg
4%
Fructose
3.53g
4%
Vitamin C
41mg
43.9mg
3%
Calcium
33mg
62mg
3%
Potassium
275mg
186mg
3%
Vitamin B2
0.05mg
0.09mg
3%
Vitamin B5
0.064mg
0.208mg
3%
Vitamin B6
0.07mg
0.036mg
3%
Magnesium
13mg
20mg
2%
Iron
1mg
0.86mg
2%
Manganese
0.186mg
0.135mg
2%
Vitamin B3
0.1mg
0.429mg
2%
Folate
8µg
17µg
2%
Calories
56kcal
71kcal
1%
Protein
1.4g
1.88g
1%
Fats
0.2g
0.86g
1%
Carbs
13.8g
15.9g
1%
Copper
0.107mg
0.095mg
1%
Zinc
0.23mg
0.17mg
1%
Vitamin A
2µg
15µg
1%
Selenium
0.6µg
0µg
1%
Polyunsaturated fat
0.088g
0.171g
1%
Protein per 100 calories
2.5g
2.6g
N/A
Calories per 10 g protein
400kcal
378kcal
N/A
Weight per 100 calories
179g
141g
N/A
Net carbs
9.5g
9.4g
N/A
Sugar
7.37g
9.36g
N/A
Sodium
1mg
10mg
0%
Vitamin E
0.1mg
0.15mg
0%
Vitamin B1
0.04mg
0.037mg
0%
Choline
7.6mg
8.4mg
0%
Saturated fat
0.017g
0.103g
0%
Monounsaturated fat
0.028g
0.154g
0%
Macronutrient Comparison
Macronutrient breakdown side-by-side comparison
2
14%
84%
Protein:
1.4 g
Fats:
0.2 g
Carbs:
13.8 g
Water:
83.95 g
Other:
0.65 g
3
2%
16%
81%
Protein:
1.88 g
Fats:
0.86 g
Carbs:
15.9 g
Water:
80.85 g
Other:
0.51 g
Contains
more
Other Other
+27.5%
Contains
more
Protein Protein
+34.3%
Contains
more
Fats Fats
+330%
Contains
more
Carbs Carbs
+15.2%
Fat Type Comparison
Fat type breakdown side-by-side comparison
1
13%
21%
66%
Saturated fat:
Sat. Fat
0.017 g
Monounsaturated fat:
Mono. Fat
0.028 g
Polyunsaturated fat:
Poly. Fat
0.088 g
2
24%
36%
40%
Saturated fat:
Sat. Fat
0.103 g
Monounsaturated fat:
Mono. Fat
0.154 g
Polyunsaturated fat:
Poly. Fat
0.171 g
Contains
less
Sat. Fat Saturated fat
-83.5%
Contains
more
Mono. Fat Monounsaturated fat
+450%
Contains
more
Poly. Fat Polyunsaturated fat
+94.3%