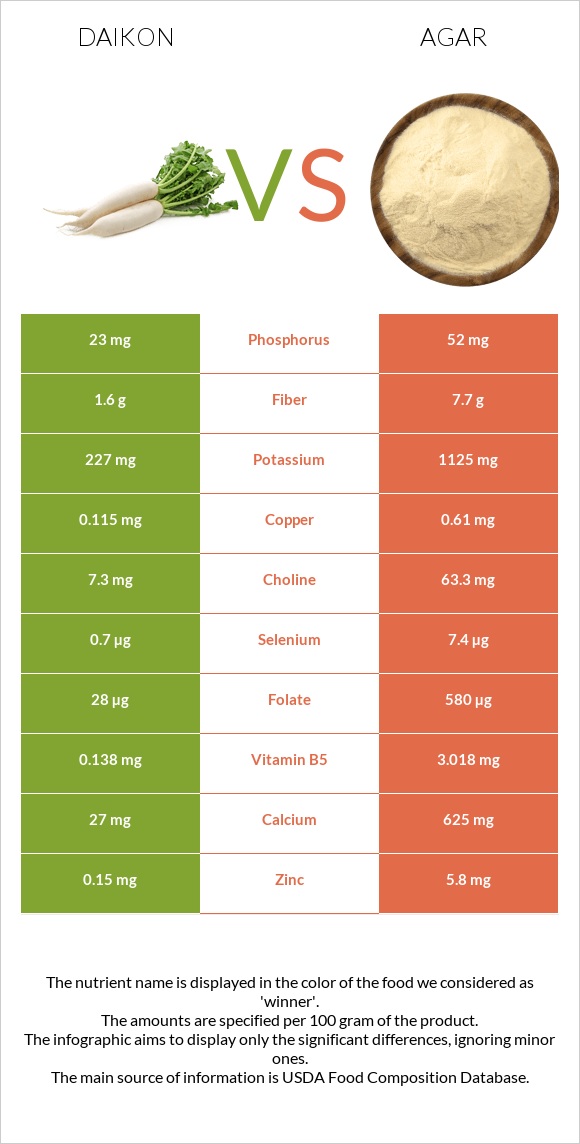
Summary of differences between daikon and agar The amount of iron, manganese, magnesium, folate, calcium, vitamin B5, copper, zinc, vitamin E, and potassium in agar is higher than in daikon. Agar covers your daily need for iron, 263% more than daikon. These are the specific foods used in this comparison Radishes, oriental, raw and Seaweed, agar, dried .
Infographic
Mineral Comparison
Mineral comparison score is based on the number of minerals by which one or the other food is richer. The "coverage" charts below show how much of the daily needs can be covered by 300 grams of the food.
1
100 g
300 g
1 cup slices - 116g 1 radish (7" long) - 338g
Magnesium
Magnesium
Calcium
Calcium
Potassium
Potassium
Iron
Iron
Copper
Copper
Zinc
Zinc
Phosphorus
Phosphorus
Sodium
Sodium
Manganese
Manganese
Selenium
Selenium
11%
8.1%
20%
15%
38%
4.1%
9.9%
2.7%
5%
3.8%
9
100 g
300 g
Magnesium
Magnesium
Calcium
Calcium
Potassium
Potassium
Iron
Iron
Copper
Copper
Zinc
Zinc
Phosphorus
Phosphorus
Sodium
Sodium
Manganese
Manganese
Selenium
Selenium
550%
188%
99%
803%
203%
158%
22%
13%
561%
40%
Vitamin Comparison
Vitamin comparison score is based on the number of vitamins by which one or the other food is richer. The "coverage" charts below show how much of the daily needs can be covered by 300 grams of the food.
2
100 g
300 g
1 cup slices - 116g 1 radish (7" long) - 338g
Vitamin C
Vit. C
Vitamin D
Vit. D
Vitamin A
Vit. A
Vitamin E
Vit. E
Vitamin B1
Vit. B1
Vitamin B2
Vit. B2
Vitamin B3
Vit. B3
Vitamin B5
Vit. B5
Vitamin B6
Vit. B6
Vitamin B12
Vit. B12
Vitamin K
Vit. K
Folate
Folate
73%
0%
0%
0%
5%
4.6%
3.8%
8.3%
11%
0%
0.75%
21%
6
100 g
300 g
Vitamin C
Vit. C
Vitamin D
Vit. D
Vitamin A
Vit. A
Vitamin E
Vit. E
Vitamin B1
Vit. B1
Vitamin B2
Vit. B2
Vitamin B3
Vit. B3
Vitamin B5
Vit. B5
Vitamin B6
Vit. B6
Vitamin B12
Vit. B12
Vitamin K
Vit. K
Folate
Folate
0%
0%
0%
100%
2.5%
51%
3.8%
181%
70%
0%
61%
435%
All nutrients comparison - raw data values
Nutrient
DV% diff.
Iron
0.4mg
21.4mg
263%
Manganese
0.038mg
4.3mg
185%
Magnesium
16mg
770mg
180%
Folate
28µg
580µg
138%
Calcium
27mg
625mg
60%
Vitamin B5
0.138mg
3.018mg
58%
Copper
0.115mg
0.61mg
55%
Zinc
0.15mg
5.8mg
51%
Vitamin E
0mg
5mg
33%
Carbs
4.1g
80.88g
26%
Potassium
227mg
1125mg
26%
Vitamin C
22mg
0mg
24%
Fiber
1.6g
7.7g
24%
Vitamin B6
0.046mg
0.303mg
20%
Vitamin K
0.3µg
24.4µg
20%
Vitamin B2
0.02mg
0.222mg
16%
Calories
18kcal
306kcal
14%
Selenium
0.7µg
7.4µg
12%
Protein
0.6g
6.21g
11%
Choline
7.3mg
63.3mg
10%
Phosphorus
23mg
52mg
4%
Sodium
21mg
102mg
4%
Vitamin B1
0.02mg
0.01mg
1%
Protein per 100 calories
3.3g
2g
N/A
Calories per 10 g protein
300kcal
493kcal
N/A
Weight per 100 calories
556g
33g
N/A
Fats
0.1g
0.3g
0%
Net carbs
2.5g
73.18g
N/A
Sugar
2.5g
2.97g
N/A
Vitamin B3
0.2mg
0.202mg
0%
Saturated fat
0.03g
0.061g
0%
Monounsaturated fat
0.017g
0.027g
0%
Polyunsaturated fat
0.045g
0.102g
0%
Tryptophan
0.003mg
0%
Threonine
0.025mg
0%
Isoleucine
0.026mg
0%
Leucine
0.031mg
0%
Lysine
0.03mg
0%
Methionine
0.006mg
0%
Phenylalanine
0.02mg
0%
Valine
0.028mg
0%
Histidine
0.011mg
0%
Omega-3 - EPA
0g
0.087g
N/A
Macronutrient Comparison
Macronutrient breakdown side-by-side comparison
1
4%
95%
Protein:
0.6 g
Fats:
0.1 g
Carbs:
4.1 g
Water:
94.62 g
Other:
0.58 g
4
6%
81%
9%
4%
Protein:
6.21 g
Fats:
0.3 g
Carbs:
80.88 g
Water:
8.68 g
Other:
3.93 g
Contains
more
Water Water
+990.1%
Contains
more
Protein Protein
+935%
Contains
more
Fats Fats
+200%
Contains
more
Carbs Carbs
+1872.7%
Contains
more
Other Other
+577.6%
Fat Type Comparison
Fat type breakdown side-by-side comparison
1
33%
18%
49%
Saturated fat:
Sat. Fat
0.03 g
Monounsaturated fat:
Mono. Fat
0.017 g
Polyunsaturated fat:
Poly. Fat
0.045 g
2
32%
14%
54%
Saturated fat:
Sat. Fat
0.061 g
Monounsaturated fat:
Mono. Fat
0.027 g
Polyunsaturated fat:
Poly. Fat
0.102 g
Contains
less
Sat. Fat Saturated fat
-50.8%
Contains
more
Mono. Fat Monounsaturated fat
+58.8%
Contains
more
Poly. Fat Polyunsaturated fat
+126.7%