Infographic
Mineral Comparison
Mineral comparison score is based on the number of minerals by which one or the other food is richer. The "coverage" charts below show how much of the daily needs can be covered by 300 grams of the food.
6
100 g
300 g
1 fl oz - 30.2g 1 cocktail (2 fl oz) - 60g
Magnesium
Magnesium
Calcium
Calcium
Potassium
Potassium
Iron
Iron
Copper
Copper
Zinc
Zinc
Phosphorus
Phosphorus
Sodium
Sodium
Manganese
Manganese
Selenium
Selenium
1.4%
0.9%
1.9%
3.4%
7.3%
1.1%
2.1%
0.65%
2%
0.55%
4
100 g
300 g
1 fl oz - 29.6g 6 fl oz - 178g 1 cup (8 fl oz) - 237g
Magnesium
Magnesium
Calcium
Calcium
Potassium
Potassium
Iron
Iron
Copper
Copper
Zinc
Zinc
Phosphorus
Phosphorus
Sodium
Sodium
Manganese
Manganese
Selenium
Selenium
2.1%
0.6%
4.3%
0.38%
0.67%
0.55%
1.3%
0.26%
3%
0%
Vitamin Comparison
Vitamin comparison score is based on the number of vitamins by which one or the other food is richer. The "coverage" charts below show how much of the daily needs can be covered by 300 grams of the food.
3
100 g
300 g
1 fl oz - 30.2g 1 cocktail (2 fl oz) - 60g
Vitamin C
Vit. C
Vitamin D
Vit. D
Vitamin A
Vit. A
Vitamin E
Vit. E
Vitamin B1
Vit. B1
Vitamin B2
Vit. B2
Vitamin B3
Vit. B3
Vitamin B5
Vit. B5
Vitamin B6
Vit. B6
Vitamin B12
Vit. B12
Vitamin K
Vit. K
Folate
Folate
5.3%
0%
0%
0.6%
3.3%
1.2%
0.96%
1%
1.8%
0%
0.25%
1.5%
3
100 g
300 g
1 fl oz - 29.6g 6 fl oz - 178g 1 cup (8 fl oz) - 237g
Vitamin C
Vit. C
Vitamin D
Vit. D
Vitamin A
Vit. A
Vitamin E
Vit. E
Vitamin B1
Vit. B1
Vitamin B2
Vit. B2
Vitamin B3
Vit. B3
Vitamin B5
Vit. B5
Vitamin B6
Vit. B6
Vitamin B12
Vit. B12
Vitamin K
Vit. K
Folate
Folate
0%
0%
0%
0.2%
3.5%
18%
3.6%
15%
0.23%
0%
0.25%
1.5%
All nutrients comparison - raw data values
Nutrient
DV% diff.
Caffeine
0mg
40mg
10%
Calories
186kcal
1kcal
9%
Vitamin B2
0.005mg
0.076mg
5%
Vitamin B5
0.017mg
0.254mg
5%
Vitamin C
1.6mg
0mg
2%
Carbs
6.94g
0g
2%
Copper
0.022mg
0.002mg
2%
Potassium
21mg
49mg
1%
Iron
0.09mg
0.01mg
1%
Vitamin B3
0.051mg
0.191mg
1%
Vitamin B6
0.008mg
0.001mg
1%
Protein
0.06g
0.12g
0%
Protein per 100 calories
0.03g
12g
N/A
Calories per 10 g protein
31000kcal
83kcal
N/A
Weight per 100 calories
54g
10000g
N/A
Fats
0.06g
0.02g
0%
Net carbs
6.84g
0g
N/A
Magnesium
2mg
3mg
0%
Calcium
3mg
2mg
0%
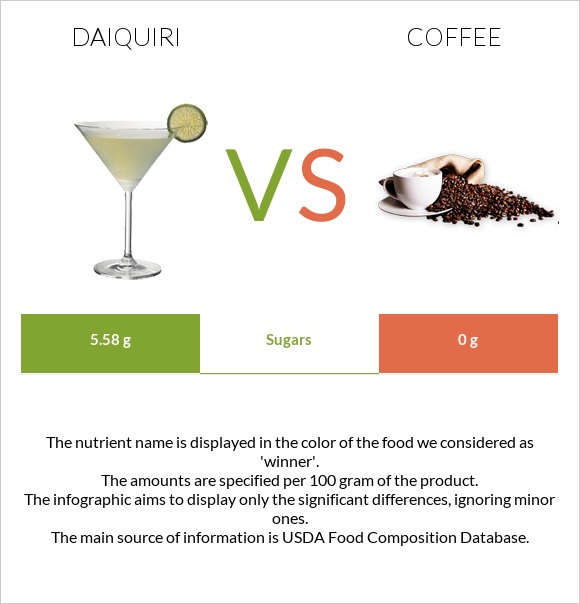
Sugar
5.58g
0g
N/A
Fiber
0.1g
0g
0%
Zinc
0.04mg
0.02mg
0%
Phosphorus
5mg
3mg
0%
Sodium
5mg
2mg
0%
Vitamin E
0.03mg
0.01mg
0%
Manganese
0.015mg
0.023mg
0%
Selenium
0.1µg
0µg
0%
Vitamin B1
0.013mg
0.014mg
0%
Vitamin K
0.1µg
0.1µg
0%
Folate
2µg
2µg
0%
Choline
2.6mg
0%
Saturated fat
0.006g
0.002g
0%
Monounsaturated fat
0.006g
0.015g
0%
Polyunsaturated fat
0.016g
0.001g
0%
Threonine
0.001mg
0%
Isoleucine
0.002mg
0%
Leucine
0.005mg
0%
Lysine
0.001mg
0%
Phenylalanine
0.003mg
0%
Valine
0.003mg
0%
Histidine
0.002mg
0%
Macronutrient Comparison
Macronutrient breakdown side-by-side comparison
3
7%
70%
23%
Protein:
0.06 g
Fats:
0.06 g
Carbs:
6.94 g
Water:
69.74 g
Other:
23.2 g
2
99%
Protein:
0.12 g
Fats:
0.02 g
Carbs:
0 g
Water:
99.39 g
Other:
0.47 g
Contains
more
Fats Fats
+200%
Contains
more
Carbs Carbs
+∞%
Contains
more
Other Other
+4836.2%
Contains
more
Protein Protein
+100%
Contains
more
Water Water
+42.5%
Fat Type Comparison
Fat type breakdown side-by-side comparison
1
21%
21%
57%
Saturated fat:
Sat. Fat
0.006 g
Monounsaturated fat:
Mono. Fat
0.006 g
Polyunsaturated fat:
Poly. Fat
0.016 g
2
11%
83%
6%
Saturated fat:
Sat. Fat
0.002 g
Monounsaturated fat:
Mono. Fat
0.015 g
Polyunsaturated fat:
Poly. Fat
0.001 g
Contains
more
Poly. Fat Polyunsaturated fat
+1500%
Contains
less
Sat. Fat Saturated fat
-66.7%
Contains
more
Mono. Fat Monounsaturated fat
+150%