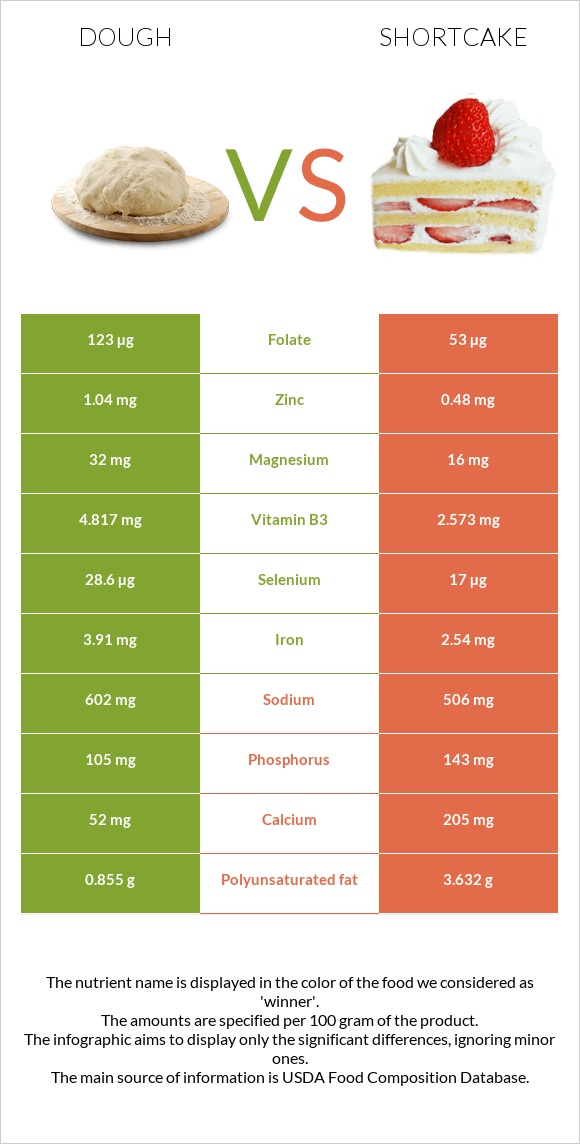
A recap on the differences between dough and shortcake Dough is higher in vitamin B1, selenium, folate, iron, vitamin B3, vitamin B2, manganese, and copper, yet shortcake is higher in calcium. Dough covers your daily vitamin B1 needs 33% more than shortcake. Dough contains 2 times more folate than shortcake. While dough contains 123µg of folate, shortcake contains only 53µg. The amount of saturated fat in dough is lower. Food varieties used in this article are Bread, french or vienna (includes sourdough) and Cake, shortcake, biscuit-type, prepared from recipe .
Infographic
Mineral Comparison
Mineral comparison score is based on the number of minerals by which one or the other food is richer. The "coverage" charts below show how much of the daily needs can be covered by 300 grams of the food.
6
100 g
300 g
1 oz - 28.35g 1 slice - 139g
Magnesium
Magnesium
Calcium
Calcium
Potassium
Potassium
Iron
Iron
Copper
Copper
Zinc
Zinc
Phosphorus
Phosphorus
Sodium
Sodium
Manganese
Manganese
Selenium
Selenium
23%
16%
10%
147%
51%
28%
45%
79%
75%
156%
3
100 g
300 g
1 oz - 28.35g
Magnesium
Magnesium
Calcium
Calcium
Potassium
Potassium
Iron
Iron
Copper
Copper
Zinc
Zinc
Phosphorus
Phosphorus
Sodium
Sodium
Manganese
Manganese
Selenium
Selenium
11%
62%
9.4%
95%
25%
13%
61%
66%
43%
93%
Vitamin Comparison
Vitamin comparison score is based on the number of vitamins by which one or the other food is richer. The "coverage" charts below show how much of the daily needs can be covered by 300 grams of the food.
8
100 g
300 g
1 oz - 28.35g 1 slice - 139g
Vitamin C
Vit. C
Vitamin D
Vit. D
Vitamin A
Vit. A
Vitamin E
Vit. E
Vitamin B1
Vit. B1
Vitamin B2
Vit. B2
Vitamin B3
Vit. B3
Vitamin B5
Vit. B5
Vitamin B6
Vit. B6
Vitamin B12
Vit. B12
Vitamin K
Vit. K
Folate
Folate
0%
0%
0%
4.2%
178%
99%
90%
27%
25%
0%
1.8%
92%
3
100 g
300 g
1 oz - 28.35g
Vitamin C
Vit. C
Vitamin D
Vit. D
Vitamin A
Vit. A
Vitamin E
Vit. E
Vitamin B1
Vit. B1
Vitamin B2
Vit. B2
Vitamin B3
Vit. B3
Vitamin B5
Vit. B5
Vitamin B6
Vit. B6
Vitamin B12
Vit. B12
Vitamin K
Vit. K
Folate
Folate
0.67%
0%
6%
0%
78%
63%
48%
15%
6.9%
8.8%
0%
40%
All nutrients comparison - raw data values
Nutrient
DV% diff.
Vitamin B1
0.71mg
0.311mg
33%
Selenium
28.6µg
17µg
21%
Polyunsaturated fat
0.855g
3.632g
19%
Fats
2.42g
14.2g
18%
Starch
44.23g
18%
Folate
123µg
53µg
18%
Iron
3.91mg
2.54mg
17%
Calcium
52mg
205mg
15%
Saturated fat
0.529g
3.772g
15%
Vitamin B3
4.817mg
2.573mg
14%
Monounsaturated fat
0.362g
6.045g
14%
Vitamin B2
0.427mg
0.272mg
12%
Manganese
0.577mg
0.33mg
11%
Protein
10.75g
6.1g
9%
Fiber
2.2g
9%
Copper
0.152mg
0.076mg
8%
Vitamin B6
0.107mg
0.03mg
6%
Zinc
1.04mg
0.48mg
5%
Phosphorus
105mg
143mg
5%
Calories
272kcal
346kcal
4%
Magnesium
32mg
16mg
4%
Sodium
602mg
506mg
4%
Vitamin B5
0.455mg
0.248mg
4%
Vitamin B12
0µg
0.07µg
3%
Vitamin A
0µg
18µg
2%
Carbs
51.88g
48.5g
1%
Cholesterol
0mg
3mg
1%
Vitamin E
0.21mg
1%
Vitamin K
0.7µg
1%
Choline
8mg
1%
Fructose
0.51g
1%
Protein per 100 calories
4g
1.8g
N/A
Calories per 10 g protein
253kcal
567kcal
N/A
Weight per 100 calories
37g
29g
N/A
Unsaturated / Saturated Fat ratio
2.3
2.6
N/A
Vitamin C
0mg
0.2mg
0%
Net carbs
49.68g
48.5g
N/A
Potassium
117mg
106mg
0%
Sugar
4.62g
N/A
Trans fat
0.005g
N/A
Tryptophan
0.076mg
0%
Threonine
0.184mg
0%
Isoleucine
0.238mg
0%
Leucine
0.449mg
0%
Lysine
0.197mg
0%
Methionine
0.115mg
0%
Phenylalanine
0.302mg
0%
Valine
0.273mg
0%
Histidine
0.14mg
0%
Omega-3 - ALA
0.063g
N/A
Omega-6 - Gamma-linoleic acid
0.001g
N/A
Omega-6 - Linoleic acid
0.788g
N/A
Macronutrient Comparison
Macronutrient breakdown side-by-side comparison
3
11%
2%
52%
33%
2%
Protein:
10.75 g
Fats:
2.42 g
Carbs:
51.88 g
Water:
33 g
Other:
1.95 g
2
6%
14%
49%
28%
3%
Protein:
6.1 g
Fats:
14.2 g
Carbs:
48.5 g
Water:
28.4 g
Other:
2.8 g
Contains
more
Protein Protein
+76.2%
Contains
more
Water Water
+16.2%
Contains
more
Fats Fats
+486.8%
Contains
more
Other Other
+43.6%
Fat Type Comparison
Fat type breakdown side-by-side comparison
1
30%
21%
49%
Saturated fat:
Sat. Fat
0.529 g
Monounsaturated fat:
Mono. Fat
0.362 g
Polyunsaturated fat:
Poly. Fat
0.855 g
2
28%
45%
27%
Saturated fat:
Sat. Fat
3.772 g
Monounsaturated fat:
Mono. Fat
6.045 g
Polyunsaturated fat:
Poly. Fat
3.632 g
Contains
less
Sat. Fat Saturated fat
-86%
Contains
more
Mono. Fat Monounsaturated fat
+1569.9%
Contains
more
Poly. Fat Polyunsaturated fat
+324.8%