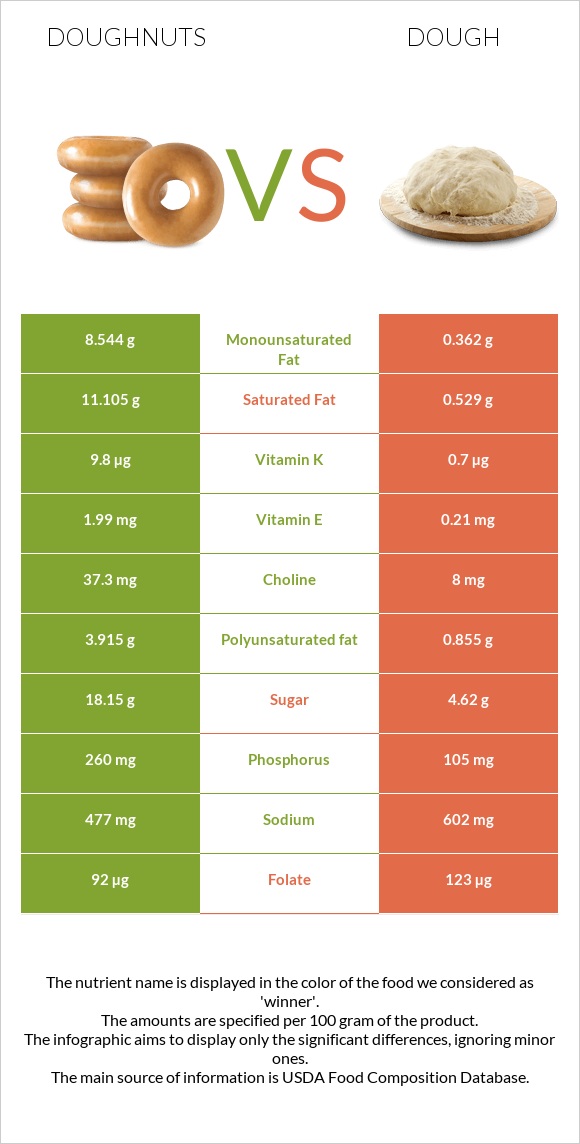
What are the differences between doughnuts and dough? Doughnuts are higher in phosphorus and vitamin E; however, dough is richer in selenium, vitamin B1, iron, vitamin B3, manganese, vitamin B2, and folate. Doughnuts' daily need coverage for saturated fat is 53% more. Dough contains 9 times less vitamin E than doughnuts. Doughnuts contain 1.99mg of vitamin E, while dough contains 0.21mg. Dough has less saturated fat. We used Doughnuts, cake-type, plain (includes unsugared, old-fashioned) and Bread, french or vienna (includes sourdough) types in this article.
Infographic
Mineral Comparison
Mineral comparison score is based on the number of minerals by which one or the other food is richer. The "coverage" charts below show how much of the daily needs can be covered by 300 grams of the food.
3
100 g
300 g
1 doughnut, mini (1-1/2" dia) or doughnut hole - 14g 1 oz - 28.35g 1 donut - 40g 1 doughnut stick - 52g 1 doughnut, long type (twist) (4-1/2" long) - 52g 1 doughnut medium (3-1/4" dia) - 54g 1 doughnut, large (4" dia) - 71g
Magnesium
Magnesium
Calcium
Calcium
Potassium
Potassium
Iron
Iron
Copper
Copper
Zinc
Zinc
Phosphorus
Phosphorus
Sodium
Sodium
Manganese
Manganese
Selenium
Selenium
12%
12%
12%
95%
30%
14%
111%
62%
43%
55%
7
100 g
300 g
1 oz - 28.35g 1 slice - 139g
Magnesium
Magnesium
Calcium
Calcium
Potassium
Potassium
Iron
Iron
Copper
Copper
Zinc
Zinc
Phosphorus
Phosphorus
Sodium
Sodium
Manganese
Manganese
Selenium
Selenium
23%
16%
10%
147%
51%
28%
45%
79%
75%
156%
Vitamin Comparison
Vitamin comparison score is based on the number of vitamins by which one or the other food is richer. The "coverage" charts below show how much of the daily needs can be covered by 300 grams of the food.
4
100 g
300 g
1 doughnut, mini (1-1/2" dia) or doughnut hole - 14g 1 oz - 28.35g 1 donut - 40g 1 doughnut stick - 52g 1 doughnut, long type (twist) (4-1/2" long) - 52g 1 doughnut medium (3-1/4" dia) - 54g 1 doughnut, large (4" dia) - 71g
Vitamin C
Vit. C
Vitamin D
Vit. D
Vitamin A
Vit. A
Vitamin E
Vit. E
Vitamin B1
Vit. B1
Vitamin B2
Vit. B2
Vitamin B3
Vit. B3
Vitamin B5
Vit. B5
Vitamin B6
Vit. B6
Vitamin B12
Vit. B12
Vitamin K
Vit. K
Folate
Folate
0%
0%
1.3%
40%
98%
69%
55%
23%
12%
7.5%
25%
69%
6
100 g
300 g
1 oz - 28.35g 1 slice - 139g
Vitamin C
Vit. C
Vitamin D
Vit. D
Vitamin A
Vit. A
Vitamin E
Vit. E
Vitamin B1
Vit. B1
Vitamin B2
Vit. B2
Vitamin B3
Vit. B3
Vitamin B5
Vit. B5
Vitamin B6
Vit. B6
Vitamin B12
Vit. B12
Vitamin K
Vit. K
Folate
Folate
0%
0%
0%
4.2%
178%
99%
90%
27%
25%
0%
1.8%
92%
All nutrients comparison - raw data values
Nutrient
DV% diff.
Saturated fat
11.105g
0.529g
48%
Fats
24.93g
2.42g
35%
Selenium
10.1µg
28.6µg
34%
Vitamin B1
0.39mg
0.71mg
27%
Phosphorus
260mg
105mg
22%
Monounsaturated fat
8.544g
0.362g
20%
Polyunsaturated fat
3.915g
0.855g
20%
Iron
2.53mg
3.91mg
17%
Vitamin E
1.99mg
0.21mg
12%
Vitamin B3
2.91mg
4.817mg
12%
Protein
5.31g
10.75g
11%
Manganese
0.333mg
0.577mg
11%
Vitamin B2
0.301mg
0.427mg
10%
Calories
434kcal
272kcal
8%
Starch
25.91g
44.23g
8%
Vitamin K
9.8µg
0.7µg
8%
Folate
92µg
123µg
8%
Copper
0.09mg
0.152mg
7%
Zinc
0.5mg
1.04mg
5%
Sodium
477mg
602mg
5%
Choline
37.3mg
8mg
5%
Magnesium
17mg
32mg
4%
Vitamin B6
0.05mg
0.107mg
4%
Cholesterol
10mg
0mg
3%
Vitamin B12
0.06µg
0µg
3%
Carbs
47.06g
51.88g
2%
Fiber
1.7g
2.2g
2%
Vitamin B5
0.377mg
0.455mg
2%
Calcium
40mg
52mg
1%
Potassium
134mg
117mg
1%
Fructose
0g
0.51g
1%
Protein per 100 calories
1.2g
4g
N/A
Calories per 10 g protein
817kcal
253kcal
N/A
Weight per 100 calories
23g
37g
N/A
Unsaturated / Saturated Fat ratio
1.1
2.3
N/A
Net carbs
45.36g
49.68g
N/A
Sugar
18.15g
4.62g
N/A
Vitamin A
4µg
0µg
0%
Trans fat
0.005g
N/A
Omega-3 - DHA
0.001g
0g
N/A
Omega-3 - ALA
0.239g
0.063g
N/A
Omega-3 - Eicosatrienoic acid
0.001g
0g
N/A
Omega-6 - Gamma-linoleic acid
0.017g
0.001g
N/A
Omega-6 - Eicosadienoic acid
0.006g
0g
N/A
Omega-6 - Linoleic acid
3.573g
0.788g
N/A
Macronutrient Comparison
Macronutrient breakdown side-by-side comparison
1
5%
25%
47%
21%
2%
Protein:
5.31 g
Fats:
24.93 g
Carbs:
47.06 g
Water:
20.82 g
Other:
1.88 g
4
11%
2%
52%
33%
2%
Protein:
10.75 g
Fats:
2.42 g
Carbs:
51.88 g
Water:
33 g
Other:
1.95 g
Contains
more
Fats Fats
+930.2%
Contains
more
Protein Protein
+102.4%
Contains
more
Carbs Carbs
+10.2%
Contains
more
Water Water
+58.5%
Fat Type Comparison
Fat type breakdown side-by-side comparison
2
47%
36%
17%
Saturated fat:
Sat. Fat
11.105 g
Monounsaturated fat:
Mono. Fat
8.544 g
Polyunsaturated fat:
Poly. Fat
3.915 g
1
30%
21%
49%
Saturated fat:
Sat. Fat
0.529 g
Monounsaturated fat:
Mono. Fat
0.362 g
Polyunsaturated fat:
Poly. Fat
0.855 g
Contains
more
Mono. Fat Monounsaturated fat
+2260.2%
Contains
more
Poly. Fat Polyunsaturated fat
+357.9%
Contains
less
Sat. Fat Saturated fat
-95.2%
Carbohydrate type comparison
Carbohydrate type breakdown side-by-side comparison
3
59%
36%
2%
Starch:
25.91 g
Sucrose:
16.02 g
Glucose:
0.67 g
Fructose:
0 g
Lactose:
0.93 g
Maltose:
0.54 g
Galactose:
0 g
3
91%
8%
Starch:
44.23 g
Sucrose:
0 g
Glucose:
0.4 g
Fructose:
0.51 g
Lactose:
0 g
Maltose:
3.7 g
Galactose:
0 g
Contains
more
Sucrose Sucrose
+∞%
Contains
more
Glucose Glucose
+67.5%
Contains
more
Lactose Lactose
+∞%
Contains
more
Starch Starch
+70.7%
Contains
more
Fructose Fructose
+∞%
Contains
more
Maltose Maltose
+585.2%