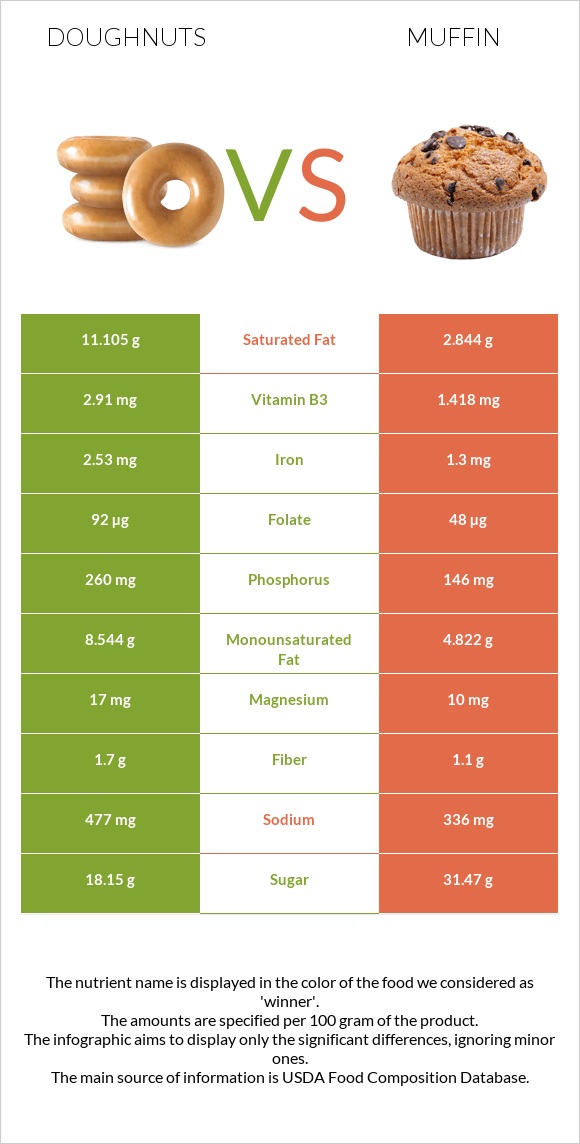
Important differences between doughnuts and muffin Doughnuts have more vitamin B1, phosphorus, iron, folate, vitamin B2, and vitamin B3; however, muffin has more vitamin K and choline. Doughnuts' daily need coverage for saturated fat is 41% more. Doughnuts have 2 times more vitamin B1 than muffin. Doughnuts have 0.39mg of vitamin B1, while muffin has 0.168mg. Muffin is lower in saturated fat. Doughnuts have a higher glycemic index than muffin. The food varieties used in the comparison are Doughnuts, cake-type, plain (includes unsugared, old-fashioned) and Muffins, blueberry, commercially prepared (Includes mini-muffins) .
Infographic
Mineral Comparison
Mineral comparison score is based on the number of minerals by which one or the other food is richer. The "coverage" charts below show how much of the daily needs can be covered by 300 grams of the food.
6
100 g
300 g
1 doughnut, mini (1-1/2" dia) or doughnut hole - 14g 1 oz - 28.35g 1 donut - 40g 1 doughnut stick - 52g 1 doughnut, long type (twist) (4-1/2" long) - 52g 1 doughnut medium (3-1/4" dia) - 54g 1 doughnut, large (4" dia) - 71g
Magnesium
Magnesium
Calcium
Calcium
Potassium
Potassium
Iron
Iron
Copper
Copper
Zinc
Zinc
Phosphorus
Phosphorus
Sodium
Sodium
Manganese
Manganese
Selenium
Selenium
12%
12%
12%
95%
30%
14%
111%
62%
43%
55%
2
100 g
300 g
1 mini (1-1/4" dia) - 17g 1 oz - 28.35g 1 muffin - 31g 1 small (2-3/4" dia x 2") - 66g 1 medium - 113g 1 large (3-1/4" dia x 2-3/4") - 139g 1 extra large - 168g
Magnesium
Magnesium
Calcium
Calcium
Potassium
Potassium
Iron
Iron
Copper
Copper
Zinc
Zinc
Phosphorus
Phosphorus
Sodium
Sodium
Manganese
Manganese
Selenium
Selenium
7.1%
13%
11%
49%
20%
10%
63%
44%
59%
45%
Vitamin Comparison
Vitamin comparison score is based on the number of vitamins by which one or the other food is richer. The "coverage" charts below show how much of the daily needs can be covered by 300 grams of the food.
6
100 g
300 g
1 doughnut, mini (1-1/2" dia) or doughnut hole - 14g 1 oz - 28.35g 1 donut - 40g 1 doughnut stick - 52g 1 doughnut, long type (twist) (4-1/2" long) - 52g 1 doughnut medium (3-1/4" dia) - 54g 1 doughnut, large (4" dia) - 71g
Vitamin C
Vit. C
Vitamin D
Vit. D
Vitamin A
Vit. A
Vitamin E
Vit. E
Vitamin B1
Vit. B1
Vitamin B2
Vit. B2
Vitamin B3
Vit. B3
Vitamin B5
Vit. B5
Vitamin B6
Vit. B6
Vitamin B12
Vit. B12
Vitamin K
Vit. K
Folate
Folate
0%
0%
1.3%
40%
98%
69%
55%
23%
12%
7.5%
25%
69%
6
100 g
300 g
1 mini (1-1/4" dia) - 17g 1 oz - 28.35g 1 muffin - 31g 1 small (2-3/4" dia x 2") - 66g 1 medium - 113g 1 large (3-1/4" dia x 2-3/4") - 139g 1 extra large - 168g
Vitamin C
Vit. C
Vitamin D
Vit. D
Vitamin A
Vit. A
Vitamin E
Vit. E
Vitamin B1
Vit. B1
Vitamin B2
Vit. B2
Vitamin B3
Vit. B3
Vitamin B5
Vit. B5
Vitamin B6
Vit. B6
Vitamin B12
Vit. B12
Vitamin K
Vit. K
Folate
Folate
3%
1.5%
7%
33%
42%
38%
27%
28%
9.2%
20%
98%
36%
All nutrients comparison - raw data values
Nutrient
DV% diff.
Saturated fat
11.105g
2.844g
38%
Polyunsaturated fat
3.915g
8.103g
28%
Vitamin K
9.8µg
39.2µg
25%
Vitamin B1
0.39mg
0.168mg
19%
Phosphorus
260mg
146mg
16%
Iron
2.53mg
1.3mg
15%
Fats
24.93g
16.07g
14%
Vitamin B2
0.301mg
0.163mg
11%
Folate
92µg
48µg
11%
Choline
37.3mg
92.5mg
10%
Vitamin B3
2.91mg
1.418mg
9%
Monounsaturated fat
8.544g
4.822g
9%
Cholesterol
10mg
30mg
7%
Sodium
477mg
336mg
6%
Manganese
0.333mg
0.449mg
5%
Starch
25.91g
16.31g
4%
Vitamin B12
0.06µg
0.16µg
4%
Calories
434kcal
375kcal
3%
Copper
0.09mg
0.06mg
3%
Selenium
10.1µg
8.2µg
3%
Protein
5.31g
4.49g
2%
Carbs
47.06g
53g
2%
Magnesium
17mg
10mg
2%
Fiber
1.7g
1.1g
2%
Vitamin A
4µg
21µg
2%
Vitamin E
1.99mg
1.63mg
2%
Vitamin B5
0.377mg
0.47mg
2%
Fructose
0g
1.21g
2%
Vitamin C
0mg
0.9mg
1%
Vitamin D*
0 IU
4 IU
1%
Vitamin D
0µg
0.1µg
1%
Zinc
0.5mg
0.37mg
1%
Vitamin B6
0.05mg
0.04mg
1%
Protein per 100 calories
1.2g
1.2g
N/A
Calories per 10 g protein
817kcal
835kcal
N/A
Weight per 100 calories
23g
27g
N/A
Unsaturated / Saturated Fat ratio
1.1
4.5
N/A
Net carbs
45.36g
51.9g
N/A
Calcium
40mg
44mg
0%
Potassium
134mg
121mg
0%
Sugar
18.15g
31.47g
N/A
Trans fat
0.2g
N/A
Tryptophan
0.066mg
0%
Threonine
0.181mg
0%
Isoleucine
0.224mg
0%
Leucine
0.421mg
0%
Lysine
0.199mg
0%
Methionine
0.115mg
0%
Phenylalanine
0.277mg
0%
Valine
0.257mg
0%
Histidine
0.128mg
0%
Omega-3 - DHA
0.001g
0.008g
N/A
Omega-3 - ALA
0.239g
1.022g
N/A
Omega-3 - DPA
0g
0.001g
N/A
Omega-3 - Eicosatrienoic acid
0.001g
0g
N/A
Omega-6 - Gamma-linoleic acid
0.017g
0.048g
N/A
Omega-6 - Dihomo-gamma-linoleic acid
0g
0.002g
N/A
Omega-6 - Eicosadienoic acid
0.006g
0.007g
N/A
Omega-6 - Linoleic acid
3.573g
6.911g
N/A
Macronutrient Comparison
Macronutrient breakdown side-by-side comparison
3
5%
25%
47%
21%
2%
Protein:
5.31 g
Fats:
24.93 g
Carbs:
47.06 g
Water:
20.82 g
Other:
1.88 g
2
4%
16%
53%
25%
Protein:
4.49 g
Fats:
16.07 g
Carbs:
53 g
Water:
24.96 g
Other:
1.48 g
Contains
more
Protein Protein
+18.3%
Contains
more
Fats Fats
+55.1%
Contains
more
Other Other
+27%
Contains
more
Carbs Carbs
+12.6%
Contains
more
Water Water
+19.9%
Fat Type Comparison
Fat type breakdown side-by-side comparison
1
47%
36%
17%
Saturated fat:
Sat. Fat
11.105 g
Monounsaturated fat:
Mono. Fat
8.544 g
Polyunsaturated fat:
Poly. Fat
3.915 g
2
18%
31%
51%
Saturated fat:
Sat. Fat
2.844 g
Monounsaturated fat:
Mono. Fat
4.822 g
Polyunsaturated fat:
Poly. Fat
8.103 g
Contains
more
Mono. Fat Monounsaturated fat
+77.2%
Contains
less
Sat. Fat Saturated fat
-74.4%
Contains
more
Poly. Fat Polyunsaturated fat
+107%
Carbohydrate type comparison
Carbohydrate type breakdown side-by-side comparison
3
59%
36%
2%
Starch:
25.91 g
Sucrose:
16.02 g
Glucose:
0.67 g
Fructose:
0 g
Lactose:
0.93 g
Maltose:
0.54 g
Galactose:
0 g
3
34%
59%
3%
3%
Starch:
16.31 g
Sucrose:
28.01 g
Glucose:
1.23 g
Fructose:
1.21 g
Lactose:
0.54 g
Maltose:
0.47 g
Galactose:
0 g
Contains
more
Starch Starch
+58.9%
Contains
more
Lactose Lactose
+72.2%
Contains
more
Maltose Maltose
+14.9%
Contains
more
Sucrose Sucrose
+74.8%
Contains
more
Glucose Glucose
+83.6%
Contains
more
Fructose Fructose
+∞%