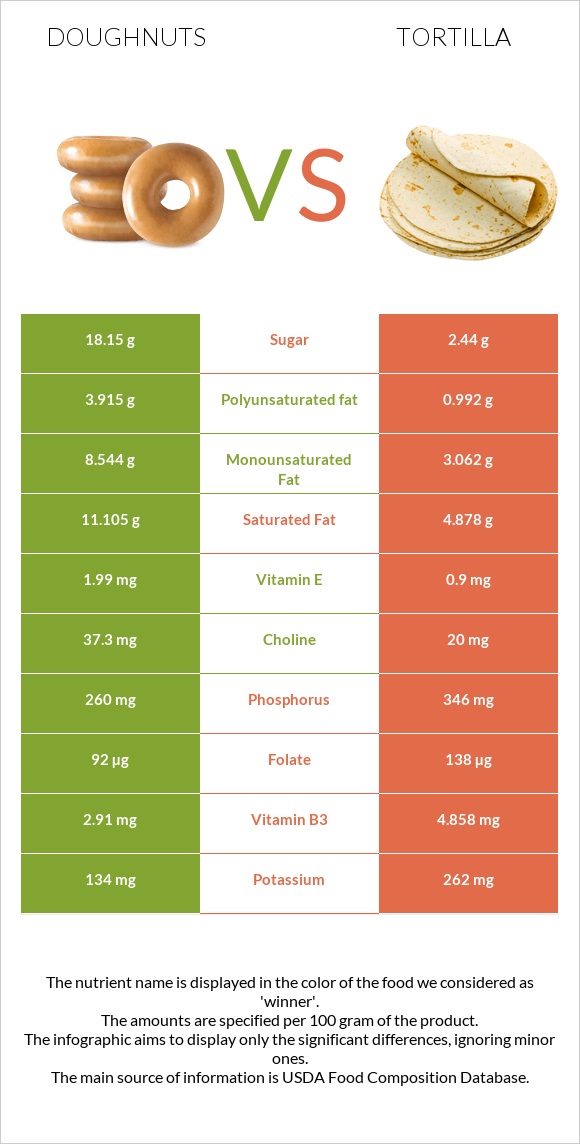
Summary of differences between doughnuts and tortillas Doughnuts have less selenium, vitamin B1, fiber, calcium, vitamin B6, copper, magnesium, zinc, and phosphorus than tortillas. Tortillas cover your daily need for selenium, 49% more than doughnuts. Doughnuts have 2 times more saturated fat than tortillas. While doughnuts have 11.105g of saturated fat, tortillas have only 4.878g. The glycemic index of doughnuts is higher. These are the specific foods used in this comparison Doughnuts, cake-type, plain (includes unsugared, old-fashioned) and Tortillas, ready-to-bake or -fry, whole wheat .
Infographic
Mineral Comparison
Mineral comparison score is based on the number of minerals by which one or the other food is richer. The "coverage" charts below show how much of the daily needs can be covered by 300 grams of the food.
1
100 g
300 g
1 doughnut, mini (1-1/2" dia) or doughnut hole - 14g 1 oz - 28.35g 1 donut - 40g 1 doughnut stick - 52g 1 doughnut, long type (twist) (4-1/2" long) - 52g 1 doughnut medium (3-1/4" dia) - 54g 1 doughnut, large (4" dia) - 71g
Magnesium
Magnesium
Calcium
Calcium
Potassium
Potassium
Iron
Iron
Copper
Copper
Zinc
Zinc
Phosphorus
Phosphorus
Sodium
Sodium
Manganese
Manganese
Selenium
Selenium
12%
12%
12%
95%
30%
14%
111%
62%
43%
55%
7
100 g
300 g
1 tortilla 1 serving - 41g
Magnesium
Magnesium
Calcium
Calcium
Potassium
Potassium
Iron
Iron
Copper
Copper
Zinc
Zinc
Phosphorus
Phosphorus
Sodium
Sodium
Manganese
Manganese
Selenium
Selenium
61%
73%
23%
99%
89%
52%
148%
67%
0%
202%
Vitamin Comparison
Vitamin comparison score is based on the number of vitamins by which one or the other food is richer. The "coverage" charts below show how much of the daily needs can be covered by 300 grams of the food.
5
100 g
300 g
1 doughnut, mini (1-1/2" dia) or doughnut hole - 14g 1 oz - 28.35g 1 donut - 40g 1 doughnut stick - 52g 1 doughnut, long type (twist) (4-1/2" long) - 52g 1 doughnut medium (3-1/4" dia) - 54g 1 doughnut, large (4" dia) - 71g
Vitamin C
Vit. C
Vitamin D
Vit. D
Vitamin A
Vit. A
Vitamin E
Vit. E
Vitamin B1
Vit. B1
Vitamin B2
Vit. B2
Vitamin B3
Vit. B3
Vitamin B5
Vit. B5
Vitamin B6
Vit. B6
Vitamin B12
Vit. B12
Vitamin K
Vit. K
Folate
Folate
0%
0%
1.3%
40%
98%
69%
55%
23%
12%
7.5%
25%
69%
4
100 g
300 g
1 tortilla 1 serving - 41g
Vitamin C
Vit. C
Vitamin D
Vit. D
Vitamin A
Vit. A
Vitamin E
Vit. E
Vitamin B1
Vit. B1
Vitamin B2
Vit. B2
Vitamin B3
Vit. B3
Vitamin B5
Vit. B5
Vitamin B6
Vit. B6
Vitamin B12
Vit. B12
Vitamin K
Vit. K
Folate
Folate
0%
0%
0%
18%
206%
67%
91%
0%
72%
0%
11%
104%
All nutrients comparison - raw data values
Nutrient
DV% diff.
Selenium
10.1µg
37µg
49%
Vitamin B1
0.39mg
0.823mg
36%
Fiber
1.7g
9.8g
32%
Saturated fat
11.105g
4.878g
28%
Fats
24.93g
9.76g
23%
Calcium
40mg
244mg
20%
Copper
0.09mg
0.266mg
20%
Vitamin B6
0.05mg
0.312mg
20%
Polyunsaturated fat
3.915g
0.992g
19%
Magnesium
17mg
85mg
16%
Manganese
0.333mg
14%
Monounsaturated fat
8.544g
3.062g
14%
Zinc
0.5mg
1.92mg
13%
Phosphorus
260mg
346mg
12%
Vitamin B3
2.91mg
4.858mg
12%
Folate
92µg
138µg
12%
Starch
25.91g
11%
Protein
5.31g
9.76g
9%
Vitamin B5
0.377mg
8%
Vitamin E
1.99mg
0.9mg
7%
Calories
434kcal
310kcal
6%
Potassium
134mg
262mg
4%
Vitamin K
9.8µg
4.5µg
4%
Cholesterol
10mg
0mg
3%
Vitamin B12
0.06µg
0µg
3%
Choline
37.3mg
20mg
3%
Sodium
477mg
512mg
2%
Iron
2.53mg
2.63mg
1%
Vitamin B2
0.301mg
0.289mg
1%
Protein per 100 calories
1.2g
3.1g
N/A
Calories per 10 g protein
817kcal
318kcal
N/A
Weight per 100 calories
23g
32g
N/A
Unsaturated / Saturated Fat ratio
1.1
0.83
N/A
Net carbs
45.36g
36.09g
N/A
Carbs
47.06g
45.89g
0%
Sugar
18.15g
2.44g
N/A
Vitamin A
4µg
0µg
0%
Tryptophan
0.129mg
0%
Threonine
0.312mg
0%
Isoleucine
0.353mg
0%
Leucine
0.671mg
0%
Lysine
0.37mg
0%
Methionine
0.163mg
0%
Phenylalanine
0.488mg
0%
Valine
0.444mg
0%
Histidine
0.255mg
0%
Omega-3 - DHA
0.001g
0g
N/A
Omega-3 - ALA
0.239g
N/A
Omega-3 - Eicosatrienoic acid
0.001g
N/A
Omega-6 - Gamma-linoleic acid
0.017g
N/A
Omega-6 - Eicosadienoic acid
0.006g
0g
N/A
Omega-6 - Linoleic acid
3.573g
N/A
Macronutrient Comparison
Macronutrient breakdown side-by-side comparison
2
5%
25%
47%
21%
2%
Protein:
5.31 g
Fats:
24.93 g
Carbs:
47.06 g
Water:
20.82 g
Other:
1.88 g
3
10%
10%
46%
30%
4%
Protein:
9.76 g
Fats:
9.76 g
Carbs:
45.89 g
Water:
30.15 g
Other:
4.44 g
Contains
more
Fats Fats
+155.4%
Contains
more
Protein Protein
+83.8%
Contains
more
Water Water
+44.8%
Contains
more
Other Other
+136.2%
Fat Type Comparison
Fat type breakdown side-by-side comparison
2
47%
36%
17%
Saturated fat:
Sat. Fat
11.105 g
Monounsaturated fat:
Mono. Fat
8.544 g
Polyunsaturated fat:
Poly. Fat
3.915 g
1
55%
34%
11%
Saturated fat:
Sat. Fat
4.878 g
Monounsaturated fat:
Mono. Fat
3.062 g
Polyunsaturated fat:
Poly. Fat
0.992 g
Contains
more
Mono. Fat Monounsaturated fat
+179%
Contains
more
Poly. Fat Polyunsaturated fat
+294.7%
Contains
less
Sat. Fat Saturated fat
-56.1%