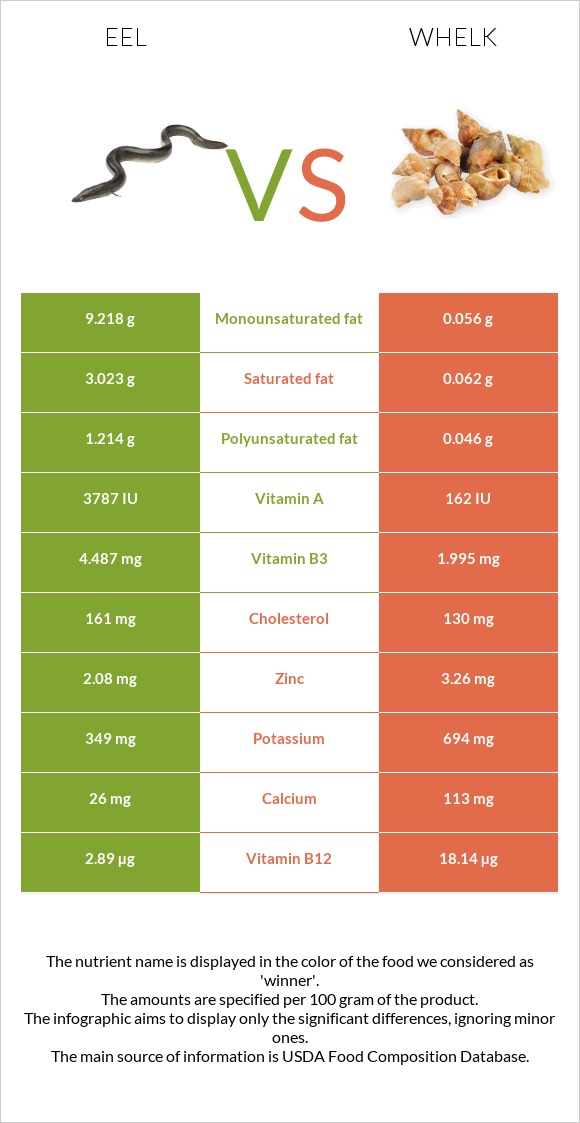
The main differences between eels and whelk Eels are richer in vitamin A and vitamin B3, yet whelk is richer in vitamin B12, copper, selenium, iron, vitamin B6, manganese, and magnesium. Daily need coverage for vitamin B12 for whelk is 635% higher. Eels contain 23 times more vitamin A than whelk. Eels contain 3787 IU of vitamin A, while whelk contains 162 IU. Eels contain less sodium. Food types used in this article are Fish, eel, mixed species, cooked, dry heat and Mollusks, whelk, unspecified, cooked, moist heat .
Infographic
Mineral Comparison
Mineral comparison score is based on the number of minerals by which one or the other food is richer. The "coverage" charts below show how much of the daily needs can be covered by 300 grams of the food.
1
100 g
300 g
1 cubic inch, boneless - 17g 1 oz with bone (yield after bone removed) - 22g 1 oz, boneless - 28.35g 3 oz - 85g 1 fillet - 159g
Magnesium
Magnesium
Calcium
Calcium
Potassium
Potassium
Iron
Iron
Copper
Copper
Zinc
Zinc
Phosphorus
Phosphorus
Sodium
Sodium
Manganese
Manganese
Selenium
Selenium
19%
7.8%
31%
24%
9.7%
57%
119%
8.5%
5.2%
45%
8
100 g
300 g
3 oz - 85g
Magnesium
Magnesium
Calcium
Calcium
Potassium
Potassium
Iron
Iron
Copper
Copper
Zinc
Zinc
Phosphorus
Phosphorus
Sodium
Sodium
Manganese
Manganese
Selenium
Selenium
123%
34%
61%
377%
687%
89%
121%
54%
116%
489%
Vitamin Comparison
Vitamin comparison score is based on the number of vitamins by which one or the other food is richer. The "coverage" charts below show how much of the daily needs can be covered by 300 grams of the food.
4
100 g
300 g
1 cubic inch, boneless - 17g 1 oz with bone (yield after bone removed) - 22g 1 oz, boneless - 28.35g 3 oz - 85g 1 fillet - 159g
Vitamin C
Vit. C
Vitamin D
Vit. D
Vitamin A
Vit. A
Vitamin E
Vit. E
Vitamin B1
Vit. B1
Vitamin B2
Vit. B2
Vitamin B3
Vit. B3
Vitamin B5
Vit. B5
Vitamin B6
Vit. B6
Vitamin B12
Vit. B12
Vitamin K
Vit. K
Folate
Folate
6%
0%
379%
0%
46%
12%
84%
17%
18%
361%
0%
13%
5
100 g
300 g
3 oz - 85g
Vitamin C
Vit. C
Vitamin D
Vit. D
Vitamin A
Vit. A
Vitamin E
Vit. E
Vitamin B1
Vit. B1
Vitamin B2
Vit. B2
Vitamin B3
Vit. B3
Vitamin B5
Vit. B5
Vitamin B6
Vit. B6
Vitamin B12
Vit. B12
Vitamin K
Vit. K
Folate
Folate
23%
0%
16%
0%
12%
49%
37%
24%
150%
2268%
0%
8.3%
All nutrients comparison - raw data values
Nutrient
DV% diff.
Vitamin B12
2.89µg
18.14µg
635%
Copper
0.029mg
2.06mg
226%
Selenium
8.3µg
89.6µg
148%
Vitamin A
1137µg
49µg
121%
Iron
0.64mg
10.06mg
118%
Protein
23.65g
47.68g
48%
Vitamin B6
0.077mg
0.65mg
44%
Manganese
0.04mg
0.89mg
37%
Magnesium
26mg
172mg
35%
Monounsaturated fat
9.218g
0.056g
23%
Fats
14.95g
0.8g
22%
Vitamin B3
4.487mg
1.995mg
16%
Sodium
65mg
412mg
15%
Vitamin B2
0.051mg
0.214mg
13%
Saturated fat
3.023g
0.062g
13%
Zinc
2.08mg
3.26mg
11%
Vitamin B1
0.183mg
0.049mg
11%
Cholesterol
161mg
130mg
10%
Potassium
349mg
694mg
10%
Calcium
26mg
113mg
9%
Polyunsaturated fat
1.214g
0.046g
8%
Vitamin C
1.8mg
6.8mg
6%
Carbs
0g
15.52g
5%
Calories
236kcal
275kcal
2%
Vitamin B5
0.28mg
0.4mg
2%
Folate
17µg
11µg
2%
Phosphorus
277mg
282mg
1%
Protein per 100 calories
10g
17g
N/A
Calories per 10 g protein
100kcal
58kcal
N/A
Weight per 100 calories
42g
36g
N/A
Unsaturated / Saturated Fat ratio
3.5
1.6
N/A
Net carbs
0g
15.52g
N/A
Tryptophan
0.265mg
0.618mg
0%
Threonine
1.037mg
2.136mg
0%
Isoleucine
1.09mg
1.655mg
0%
Leucine
1.922mg
3.807mg
0%
Lysine
2.171mg
2.93mg
0%
Methionine
0.7mg
1.205mg
0%
Phenylalanine
0.923mg
1.648mg
0%
Valine
1.218mg
2.075mg
0%
Histidine
0.696mg
0.977mg
0%
Omega-3 - EPA
0.108g
0.008g
N/A
Omega-3 - DHA
0.081g
0.012g
N/A
Omega-3 - DPA
0.095g
N/A
Macronutrient Comparison
Macronutrient breakdown side-by-side comparison
2
24%
15%
59%
2%
Protein:
23.65 g
Fats:
14.95 g
Carbs:
0 g
Water:
59.31 g
Other:
2.09 g
3
48%
16%
32%
4%
Protein:
47.68 g
Fats:
0.8 g
Carbs:
15.52 g
Water:
32 g
Other:
4 g
Contains
more
Fats Fats
+1768.8%
Contains
more
Water Water
+85.3%
Contains
more
Protein Protein
+101.6%
Contains
more
Carbs Carbs
+∞%
Contains
more
Other Other
+91.4%
Fat Type Comparison
Fat type breakdown side-by-side comparison
2
22%
69%
9%
Saturated fat:
Sat. Fat
3.023 g
Monounsaturated fat:
Mono. Fat
9.218 g
Polyunsaturated fat:
Poly. Fat
1.214 g
1
38%
34%
28%
Saturated fat:
Sat. Fat
0.062 g
Monounsaturated fat:
Mono. Fat
0.056 g
Polyunsaturated fat:
Poly. Fat
0.046 g
Contains
more
Mono. Fat Monounsaturated fat
+16360.7%
Contains
more
Poly. Fat Polyunsaturated fat
+2539.1%
Contains
less
Sat. Fat Saturated fat
-97.9%