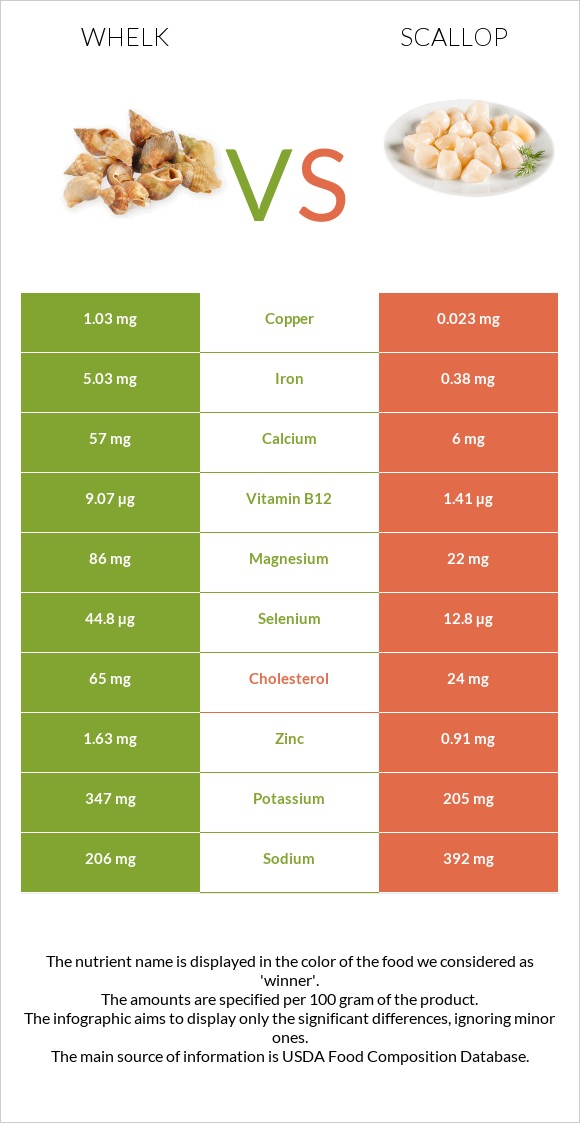
Significant differences between whelk and scallop The amount of vitamin B12, copper, selenium, iron, vitamin B6, manganese, magnesium, zinc, and vitamin B2 in whelk is higher than in scallop. Whelk covers your daily vitamin B12 needs 697% more than scallop. Scallop has 90 times less copper than whelk. Whelk has 2.06mg of copper, while scallop has 0.023mg. Scallop contains less cholesterol. Specific food types used in this comparison are Mollusks, whelk, unspecified, cooked, moist heat and Mollusks, scallop, mixed species, raw .
Infographic
Mineral Comparison
Mineral comparison score is based on the number of minerals by which one or the other food is richer. The "coverage" charts below show how much of the daily needs can be covered by 300 grams of the food.
8
100 g
300 g
3 oz - 85g
Magnesium
Magnesium
Calcium
Calcium
Potassium
Potassium
Iron
Iron
Copper
Copper
Zinc
Zinc
Phosphorus
Phosphorus
Sodium
Sodium
Manganese
Manganese
Selenium
Selenium
123%
34%
61%
377%
687%
89%
121%
54%
116%
489%
1
100 g
300 g
1 unit 2 large or 5 small - 30g 3 oz - 85g
Magnesium
Magnesium
Calcium
Calcium
Potassium
Potassium
Iron
Iron
Copper
Copper
Zinc
Zinc
Phosphorus
Phosphorus
Sodium
Sodium
Manganese
Manganese
Selenium
Selenium
16%
1.8%
18%
14%
7.7%
25%
143%
51%
2.2%
70%
Vitamin Comparison
Vitamin comparison score is based on the number of vitamins by which one or the other food is richer. The "coverage" charts below show how much of the daily needs can be covered by 300 grams of the food.
8
100 g
300 g
3 oz - 85g
Vitamin C
Vit. C
Vitamin D
Vit. D
Vitamin A
Vit. A
Vitamin E
Vit. E
Vitamin B1
Vit. B1
Vitamin B2
Vit. B2
Vitamin B3
Vit. B3
Vitamin B5
Vit. B5
Vitamin B6
Vit. B6
Vitamin B12
Vit. B12
Vitamin K
Vit. K
Folate
Folate
23%
0%
16%
0%
12%
49%
37%
24%
150%
2268%
0%
8.3%
1
100 g
300 g
1 unit 2 large or 5 small - 30g 3 oz - 85g
Vitamin C
Vit. C
Vitamin D
Vit. D
Vitamin A
Vit. A
Vitamin E
Vit. E
Vitamin B1
Vit. B1
Vitamin B2
Vit. B2
Vitamin B3
Vit. B3
Vitamin B5
Vit. B5
Vitamin B6
Vit. B6
Vitamin B12
Vit. B12
Vitamin K
Vit. K
Folate
Folate
0%
0%
0.33%
0%
1.8%
3.5%
13%
13%
17%
176%
0%
12%
All nutrients comparison - raw data values
Nutrient
DV% diff.
Vitamin B12
18.14µg
1.41µg
697%
Copper
2.06mg
0.023mg
226%
Selenium
89.6µg
12.8µg
140%
Iron
10.06mg
0.38mg
121%
Protein
47.68g
12.06g
71%
Vitamin B6
0.65mg
0.073mg
44%
Manganese
0.89mg
0.017mg
38%
Magnesium
172mg
22mg
36%
Cholesterol
130mg
24mg
35%
Zinc
3.26mg
0.91mg
21%
Vitamin B2
0.214mg
0.015mg
15%
Potassium
694mg
205mg
14%
Choline
65mg
12%
Calcium
113mg
6mg
11%
Calories
275kcal
69kcal
10%
Vitamin C
6.8mg
0mg
8%
Vitamin B3
1.995mg
0.703mg
8%
Phosphorus
282mg
334mg
7%
Vitamin A
49µg
1µg
5%
Carbs
15.52g
3.18g
4%
Vitamin B1
0.049mg
0.007mg
4%
Vitamin B5
0.4mg
0.215mg
4%
Starch
2.17g
1%
Sodium
412mg
392mg
1%
Folate
11µg
16µg
1%
Polyunsaturated fat
0.046g
0.13g
1%
Protein per 100 calories
17g
17g
N/A
Calories per 10 g protein
58kcal
57kcal
N/A
Weight per 100 calories
36g
145g
N/A
Fats
0.8g
0.49g
0%
Net carbs
15.52g
3.18g
N/A
Vitamin D*
1 IU
0%
Trans fat
0.005g
N/A
Saturated fat
0.062g
0.128g
0%
Monounsaturated fat
0.056g
0.048g
0%
Tryptophan
0.618mg
0.102mg
0%
Threonine
2.136mg
0.369mg
0%
Isoleucine
1.655mg
0.406mg
0%
Leucine
3.807mg
0.72mg
0%
Lysine
2.93mg
0.739mg
0%
Methionine
1.205mg
0.286mg
0%
Phenylalanine
1.648mg
0.351mg
0%
Valine
2.075mg
0.379mg
0%
Histidine
0.977mg
0.185mg
0%
Omega-3 - EPA
0.008g
0.042g
N/A
Omega-3 - DHA
0.012g
0.061g
N/A
Omega-3 - ALA
0.003g
N/A
Omega-3 - DPA
0.003g
N/A
Omega-6 - Dihomo-gamma-linoleic acid
0.002g
N/A
Omega-6 - Eicosadienoic acid
0.001g
N/A
Omega-6 - Linoleic acid
0.007g
N/A
Macronutrient Comparison
Macronutrient breakdown side-by-side comparison
4
48%
16%
32%
4%
Protein:
47.68 g
Fats:
0.8 g
Carbs:
15.52 g
Water:
32 g
Other:
4 g
1
12%
3%
83%
2%
Protein:
12.06 g
Fats:
0.49 g
Carbs:
3.18 g
Water:
82.53 g
Other:
1.74 g
Contains
more
Protein Protein
+295.4%
Contains
more
Fats Fats
+63.3%
Contains
more
Carbs Carbs
+388.1%
Contains
more
Other Other
+129.9%
Contains
more
Water Water
+157.9%
Fat Type Comparison
Fat type breakdown side-by-side comparison
2
38%
34%
28%
Saturated fat:
Sat. Fat
0.062 g
Monounsaturated fat:
Mono. Fat
0.056 g
Polyunsaturated fat:
Poly. Fat
0.046 g
1
42%
16%
42%
Saturated fat:
Sat. Fat
0.128 g
Monounsaturated fat:
Mono. Fat
0.048 g
Polyunsaturated fat:
Poly. Fat
0.13 g
Contains
less
Sat. Fat Saturated fat
-51.6%
Contains
more
Mono. Fat Monounsaturated fat
+16.7%
Contains
more
Poly. Fat Polyunsaturated fat
+182.6%