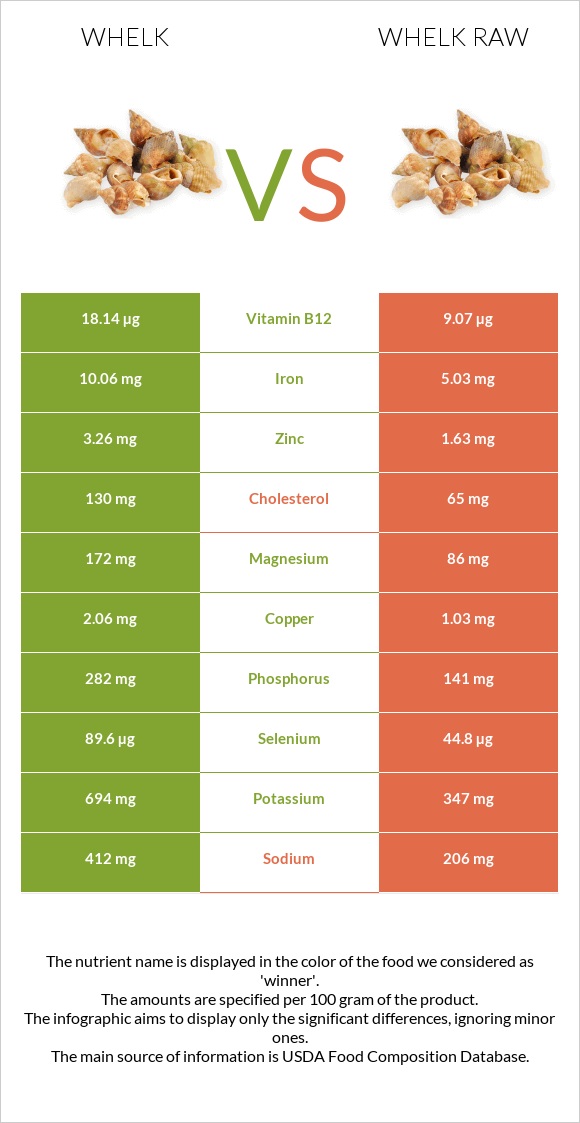
A recap on the differences between whelk and whelk raw Whelk is higher than whelk raw in vitamin B12, copper, selenium, iron, vitamin B6, magnesium, phosphorus, manganese, and zinc. Whelk covers your daily vitamin B12 needs 378% more than whelk raw. Whelk contains 2 times more copper than whelk raw. While whelk contains 2.06mg of copper, whelk raw contains only 1.03mg. The amount of cholesterol in whelk raw is lower. Food varieties used in this article are Mollusks, whelk, unspecified, cooked, moist heat and Mollusks, whelk, unspecified, raw .
Infographic
Mineral Comparison
Mineral comparison score is based on the number of minerals by which one or the other food is richer. The "coverage" charts below show how much of the daily needs can be covered by 300 grams of the food.
9
100 g
300 g
3 oz - 85g
Magnesium
Magnesium
Calcium
Calcium
Potassium
Potassium
Iron
Iron
Copper
Copper
Zinc
Zinc
Phosphorus
Phosphorus
Sodium
Sodium
Manganese
Manganese
Selenium
Selenium
123%
34%
61%
377%
687%
89%
121%
54%
116%
489%
1
100 g
300 g
3 oz - 85g
Magnesium
Magnesium
Calcium
Calcium
Potassium
Potassium
Iron
Iron
Copper
Copper
Zinc
Zinc
Phosphorus
Phosphorus
Sodium
Sodium
Manganese
Manganese
Selenium
Selenium
61%
17%
31%
189%
343%
44%
60%
27%
58%
244%
Vitamin Comparison
Vitamin comparison score is based on the number of vitamins by which one or the other food is richer. The "coverage" charts below show how much of the daily needs can be covered by 300 grams of the food.
9
100 g
300 g
3 oz - 85g
Vitamin C
Vit. C
Vitamin D
Vit. D
Vitamin A
Vit. A
Vitamin E
Vit. E
Vitamin B1
Vit. B1
Vitamin B2
Vit. B2
Vitamin B3
Vit. B3
Vitamin B5
Vit. B5
Vitamin B6
Vit. B6
Vitamin B12
Vit. B12
Vitamin K
Vit. K
Folate
Folate
23%
0%
16%
0%
12%
49%
37%
24%
150%
2268%
0%
8.3%
2
100 g
300 g
3 oz - 85g
Vitamin C
Vit. C
Vitamin D
Vit. D
Vitamin A
Vit. A
Vitamin E
Vit. E
Vitamin B1
Vit. B1
Vitamin B2
Vit. B2
Vitamin B3
Vit. B3
Vitamin B5
Vit. B5
Vitamin B6
Vit. B6
Vitamin B12
Vit. B12
Vitamin K
Vit. K
Folate
Folate
13%
0%
8.7%
2.6%
6.5%
25%
20%
12%
79%
1134%
0.25%
4.5%
All nutrients comparison - raw data values
Nutrient
DV% diff.
Vitamin B12
18.14µg
9.07µg
378%
Copper
2.06mg
1.03mg
114%
Selenium
89.6µg
44.8µg
81%
Iron
10.06mg
5.03mg
63%
Protein
47.68g
23.84g
48%
Vitamin B6
0.65mg
0.342mg
24%
Cholesterol
130mg
65mg
22%
Magnesium
172mg
86mg
20%
Phosphorus
282mg
141mg
20%
Manganese
0.89mg
0.447mg
19%
Zinc
3.26mg
1.63mg
15%
Choline
65mg
12%
Potassium
694mg
347mg
10%
Sodium
412mg
206mg
9%
Vitamin B2
0.214mg
0.107mg
8%
Calories
275kcal
137kcal
7%
Calcium
113mg
57mg
6%
Vitamin B3
1.995mg
1.05mg
6%
Vitamin B5
0.4mg
0.208mg
4%
Vitamin C
6.8mg
4mg
3%
Carbs
15.52g
7.76g
3%
Vitamin A
49µg
26µg
3%
Vitamin B1
0.049mg
0.026mg
2%
Fats
0.8g
0.4g
1%
Vitamin E
0.13mg
1%
Folate
11µg
6µg
1%
Protein per 100 calories
17g
17g
N/A
Calories per 10 g protein
58kcal
57kcal
N/A
Weight per 100 calories
36g
73g
N/A
Net carbs
15.52g
7.76g
N/A
Vitamin K
0.1µg
0%
Saturated fat
0.062g
0.031g
0%
Monounsaturated fat
0.056g
0.028g
0%
Polyunsaturated fat
0.046g
0.023g
0%
Tryptophan
0.618mg
0.309mg
0%
Threonine
2.136mg
1.068mg
0%
Isoleucine
1.655mg
0.828mg
0%
Leucine
3.807mg
1.903mg
0%
Lysine
2.93mg
1.465mg
0%
Methionine
1.205mg
0.603mg
0%
Phenylalanine
1.648mg
0.824mg
0%
Valine
2.075mg
1.037mg
0%
Histidine
0.977mg
0.488mg
0%
Omega-3 - EPA
0.008g
0.004g
N/A
Omega-3 - DHA
0.012g
0.006g
N/A
Macronutrient Comparison
Macronutrient breakdown side-by-side comparison
4
48%
16%
32%
4%
Protein:
47.68 g
Fats:
0.8 g
Carbs:
15.52 g
Water:
32 g
Other:
4 g
1
24%
8%
66%
2%
Protein:
23.84 g
Fats:
0.4 g
Carbs:
7.76 g
Water:
66 g
Other:
2 g
Contains
more
Protein Protein
+100%
Contains
more
Fats Fats
+100%
Contains
more
Carbs Carbs
+100%
Contains
more
Other Other
+100%
Contains
more
Water Water
+106.3%
Fat Type Comparison
Fat type breakdown side-by-side comparison
2
38%
34%
28%
Saturated fat:
Sat. Fat
0.062 g
Monounsaturated fat:
Mono. Fat
0.056 g
Polyunsaturated fat:
Poly. Fat
0.046 g
1
38%
34%
28%
Saturated fat:
Sat. Fat
0.031 g
Monounsaturated fat:
Mono. Fat
0.028 g
Polyunsaturated fat:
Poly. Fat
0.023 g
Contains
more
Mono. Fat Monounsaturated fat
+100%
Contains
more
Poly. Fat Polyunsaturated fat
+100%
Contains
less
Sat. Fat Saturated fat
-50%