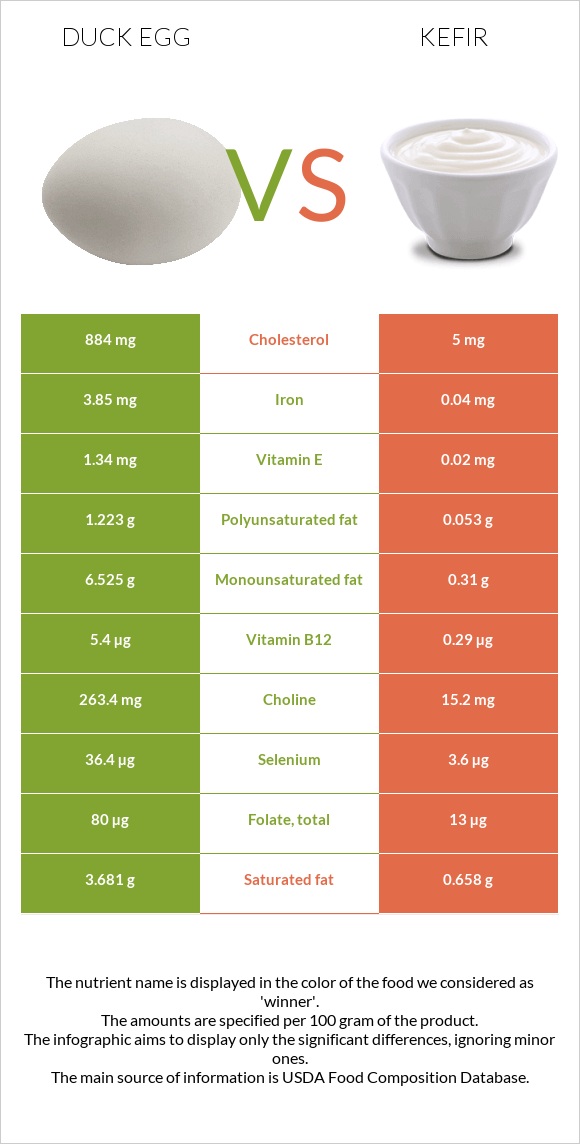
What are the differences between duck eggs and kefir? The amount of vitamin B12, selenium, iron, choline, vitamin B5, vitamin B2, folate, and phosphorus in duck eggs is higher than in kefir. Duck eggs' daily need coverage for cholesterol is 293% more. Kefir contains 96 times less iron than duck eggs. Duck eggs contain 3.85mg of iron, while kefir contains 0.04mg. Kefir has less cholesterol. We used Egg, duck, whole, fresh, raw and Kefir, lowfat, plain, LIFEWAY types in this article.
Infographic
Mineral Comparison
Mineral comparison score is based on the number of minerals by which one or the other food is richer. The "coverage" charts below show how much of the daily needs can be covered by 300 grams of the food.
8
100 g
300 g
1 egg - 70g
Magnesium
Magnesium
Calcium
Calcium
Potassium
Potassium
Iron
Iron
Copper
Copper
Zinc
Zinc
Phosphorus
Phosphorus
Sodium
Sodium
Manganese
Manganese
Selenium
Selenium
12%
19%
20%
144%
21%
38%
94%
19%
5%
199%
2
100 g
300 g
Magnesium
Magnesium
Calcium
Calcium
Potassium
Potassium
Iron
Iron
Copper
Copper
Zinc
Zinc
Phosphorus
Phosphorus
Sodium
Sodium
Manganese
Manganese
Selenium
Selenium
8.6%
39%
14%
1.5%
3%
13%
45%
5.2%
0.65%
20%
Vitamin Comparison
Vitamin comparison score is based on the number of vitamins by which one or the other food is richer. The "coverage" charts below show how much of the daily needs can be covered by 300 grams of the food.
11
100 g
300 g
1 egg - 70g
Vitamin C
Vit. C
Vitamin D
Vit. D
Vitamin A
Vit. A
Vitamin E
Vit. E
Vitamin B1
Vit. B1
Vitamin B2
Vit. B2
Vitamin B3
Vit. B3
Vitamin B5
Vit. B5
Vitamin B6
Vit. B6
Vitamin B12
Vit. B12
Vitamin K
Vit. K
Folate
Folate
0%
26%
65%
27%
39%
93%
3.8%
112%
58%
675%
1%
60%
1
100 g
300 g
Vitamin C
Vit. C
Vitamin D
Vit. D
Vitamin A
Vit. A
Vitamin E
Vit. E
Vitamin B1
Vit. B1
Vitamin B2
Vit. B2
Vitamin B3
Vit. B3
Vitamin B5
Vit. B5
Vitamin B6
Vit. B6
Vitamin B12
Vit. B12
Vitamin K
Vit. K
Folate
Folate
0.67%
15%
57%
0.4%
7.5%
31%
2.8%
23%
13%
36%
0.25%
9.8%
All nutrients comparison - raw data values
Nutrient
DV% diff.
Cholesterol
884mg
5mg
293%
Vitamin B12
5.4µg
0.29µg
213%
Selenium
36.4µg
3.6µg
60%
Iron
3.85mg
0.04mg
48%
Choline
263.4mg
15.2mg
45%
Vitamin B5
1.862mg
0.385mg
30%
Vitamin B2
0.404mg
0.135mg
21%
Fats
13.77g
0.93g
20%
Protein
12.81g
3.79g
18%
Folate
80µg
13µg
17%
Phosphorus
220mg
105mg
16%
Monounsaturated fat
6.525g
0.31g
16%
Vitamin B6
0.25mg
0.058mg
15%
Saturated fat
3.681g
0.658g
14%
Vitamin B1
0.156mg
0.03mg
11%
Zinc
1.41mg
0.46mg
9%
Vitamin E
1.34mg
0.02mg
9%
Polyunsaturated fat
1.223g
0.053g
8%
Calories
185kcal
41kcal
7%
Calcium
64mg
130mg
7%
Copper
0.062mg
0.009mg
6%
Sodium
146mg
40mg
5%
Vitamin D*
69 IU
41 IU
4%
Vitamin D
1.7µg
1µg
4%
Vitamin A
194µg
171µg
3%
Potassium
222mg
164mg
2%
Carbs
1.45g
4.48g
1%
Magnesium
17mg
12mg
1%
Manganese
0.038mg
0.005mg
1%
Protein per 100 calories
6.9g
9.2g
N/A
Calories per 10 g protein
144kcal
108kcal
N/A
Weight per 100 calories
54g
244g
N/A
Unsaturated / Saturated Fat ratio
2.1
0.55
N/A
Vitamin C
0mg
0.2mg
0%
Net carbs
1.45g
4.48g
N/A
Sugar
0.93g
4.61g
N/A
Vitamin B3
0.2mg
0.15mg
0%
Vitamin K
0.4µg
0.1µg
0%
Trans fat
0.037g
N/A
Tryptophan
0.26mg
0%
Threonine
0.736mg
0%
Isoleucine
0.598mg
0%
Leucine
1.097mg
0%
Lysine
0.951mg
0%
Methionine
0.576mg
0%
Phenylalanine
0.84mg
0%
Valine
0.885mg
0%
Histidine
0.32mg
0%
Omega-3 - ALA
0.006g
N/A
Omega-3 - DPA
0g
0.001g
N/A
Omega-6 - Dihomo-gamma-linoleic acid
0.002g
N/A
Omega-6 - Linoleic acid
0.029g
N/A
Macronutrient Comparison
Macronutrient breakdown side-by-side comparison
3
13%
14%
71%
Protein:
12.81 g
Fats:
13.77 g
Carbs:
1.45 g
Water:
70.83 g
Other:
1.14 g
2
4%
4%
90%
Protein:
3.79 g
Fats:
0.93 g
Carbs:
4.48 g
Water:
90.07 g
Other:
0.73 g
Contains
more
Protein Protein
+238%
Contains
more
Fats Fats
+1380.6%
Contains
more
Other Other
+56.2%
Contains
more
Carbs Carbs
+209%
Contains
more
Water Water
+27.2%
Fat Type Comparison
Fat type breakdown side-by-side comparison
2
32%
57%
11%
Saturated fat:
Sat. Fat
3.681 g
Monounsaturated fat:
Mono. Fat
6.525 g
Polyunsaturated fat:
Poly. Fat
1.223 g
1
64%
30%
5%
Saturated fat:
Sat. Fat
0.658 g
Monounsaturated fat:
Mono. Fat
0.31 g
Polyunsaturated fat:
Poly. Fat
0.053 g
Contains
more
Mono. Fat Monounsaturated fat
+2004.8%
Contains
more
Poly. Fat Polyunsaturated fat
+2207.5%
Contains
less
Sat. Fat Saturated fat
-82.1%