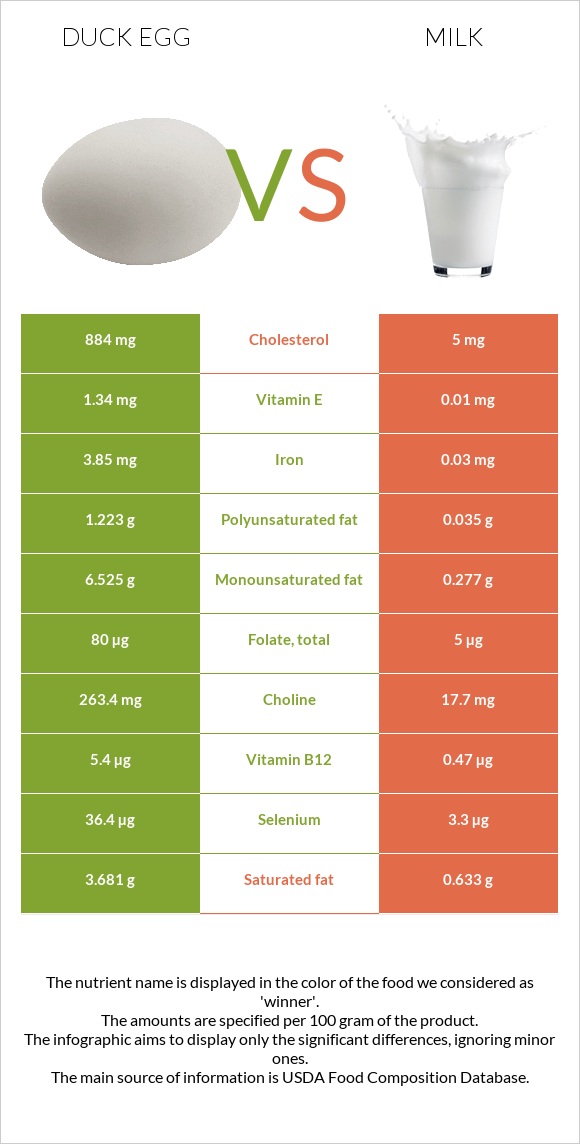
Significant differences between duck eggs and milk The amount of vitamin B12, selenium, iron, choline, vitamin B5, folate, phosphorus, vitamin B2, and vitamin B6 in duck eggs is higher than in milk. Duck eggs cover your daily cholesterol needs 293% more than milk. Milk has 128 times less iron than duck eggs. Duck eggs have 3.85mg of iron, while milk has 0.03mg. Milk contains less cholesterol. Specific food types used in this comparison are Egg, duck, whole, fresh, raw and Milk, lowfat, fluid, 1% milkfat, with added vitamin A and vitamin D .
Infographic
Mineral Comparison
Mineral comparison score is based on the number of minerals by which one or the other food is richer. The "coverage" charts below show how much of the daily needs can be covered by 300 grams of the food.
8
100 g
300 g
1 egg - 70g
Magnesium
Magnesium
Calcium
Calcium
Potassium
Potassium
Iron
Iron
Copper
Copper
Zinc
Zinc
Phosphorus
Phosphorus
Sodium
Sodium
Manganese
Manganese
Selenium
Selenium
12%
19%
20%
144%
21%
38%
94%
19%
5%
199%
2
100 g
300 g
1 fl oz - 30.5g 1 cup - 244g 1 quart - 976g
Magnesium
Magnesium
Calcium
Calcium
Potassium
Potassium
Iron
Iron
Copper
Copper
Zinc
Zinc
Phosphorus
Phosphorus
Sodium
Sodium
Manganese
Manganese
Selenium
Selenium
7.9%
38%
13%
1.1%
3.3%
11%
41%
5.7%
0.39%
18%
Vitamin Comparison
Vitamin comparison score is based on the number of vitamins by which one or the other food is richer. The "coverage" charts below show how much of the daily needs can be covered by 300 grams of the food.
11
100 g
300 g
1 egg - 70g
Vitamin C
Vit. C
Vitamin D
Vit. D
Vitamin A
Vit. A
Vitamin E
Vit. E
Vitamin B1
Vit. B1
Vitamin B2
Vit. B2
Vitamin B3
Vit. B3
Vitamin B5
Vit. B5
Vitamin B6
Vit. B6
Vitamin B12
Vit. B12
Vitamin K
Vit. K
Folate
Folate
0%
26%
65%
27%
39%
93%
3.8%
112%
58%
675%
1%
60%
0
100 g
300 g
1 fl oz - 30.5g 1 cup - 244g 1 quart - 976g
Vitamin C
Vit. C
Vitamin D
Vit. D
Vitamin A
Vit. A
Vitamin E
Vit. E
Vitamin B1
Vit. B1
Vitamin B2
Vit. B2
Vitamin B3
Vit. B3
Vitamin B5
Vit. B5
Vitamin B6
Vit. B6
Vitamin B12
Vit. B12
Vitamin K
Vit. K
Folate
Folate
0%
18%
19%
0.2%
5%
43%
1.7%
22%
8.5%
59%
0.25%
3.8%
All nutrients comparison - raw data values
Nutrient
DV% diff.
Cholesterol
884mg
5mg
293%
Vitamin B12
5.4µg
0.47µg
205%
Selenium
36.4µg
3.3µg
60%
Iron
3.85mg
0.03mg
48%
Choline
263.4mg
17.7mg
45%
Vitamin B5
1.862mg
0.361mg
30%
Fats
13.77g
0.97g
20%
Protein
12.81g
3.37g
19%
Folate
80µg
5µg
19%
Phosphorus
220mg
95mg
18%
Vitamin B2
0.404mg
0.185mg
17%
Vitamin B6
0.25mg
0.037mg
16%
Monounsaturated fat
6.525g
0.277g
16%
Vitamin A
194µg
58µg
15%
Saturated fat
3.681g
0.633g
14%
Vitamin B1
0.156mg
0.02mg
11%
Zinc
1.41mg
0.42mg
9%
Vitamin E
1.34mg
0.01mg
9%
Polyunsaturated fat
1.223g
0.035g
8%
Calories
185kcal
42kcal
7%
Calcium
64mg
125mg
6%
Copper
0.062mg
0.01mg
6%
Sodium
146mg
44mg
4%
Vitamin D*
69 IU
48 IU
3%
Vitamin D
1.7µg
1.2µg
3%
Potassium
222mg
150mg
2%
Manganese
0.038mg
0.003mg
2%
Carbs
1.45g
4.99g
1%
Magnesium
17mg
11mg
1%
Vitamin B3
0.2mg
0.093mg
1%
Protein per 100 calories
6.9g
8g
N/A
Calories per 10 g protein
144kcal
125kcal
N/A
Weight per 100 calories
54g
238g
N/A
Unsaturated / Saturated Fat ratio
2.1
0.49
N/A
Net carbs
1.45g
4.99g
N/A
Sugar
0.93g
5.2g
N/A
Vitamin K
0.4µg
0.1µg
0%
Tryptophan
0.26mg
0.043mg
0%
Threonine
0.736mg
0.143mg
0%
Isoleucine
0.598mg
0.174mg
0%
Leucine
1.097mg
0.319mg
0%
Lysine
0.951mg
0.282mg
0%
Methionine
0.576mg
0.088mg
0%
Phenylalanine
0.84mg
0.174mg
0%
Valine
0.885mg
0.22mg
0%
Histidine
0.32mg
0.101mg
0%
Omega-3 - ALA
0.004g
N/A
Omega-6 - Linoleic acid
0.027g
N/A
Macronutrient Comparison
Macronutrient breakdown side-by-side comparison
3
13%
14%
71%
Protein:
12.81 g
Fats:
13.77 g
Carbs:
1.45 g
Water:
70.83 g
Other:
1.14 g
2
3%
5%
90%
Protein:
3.37 g
Fats:
0.97 g
Carbs:
4.99 g
Water:
89.92 g
Other:
0.75 g
Contains
more
Protein Protein
+280.1%
Contains
more
Fats Fats
+1319.6%
Contains
more
Other Other
+52%
Contains
more
Carbs Carbs
+244.1%
Contains
more
Water Water
+27%
Fat Type Comparison
Fat type breakdown side-by-side comparison
2
32%
57%
11%
Saturated fat:
Sat. Fat
3.681 g
Monounsaturated fat:
Mono. Fat
6.525 g
Polyunsaturated fat:
Poly. Fat
1.223 g
1
67%
29%
4%
Saturated fat:
Sat. Fat
0.633 g
Monounsaturated fat:
Mono. Fat
0.277 g
Polyunsaturated fat:
Poly. Fat
0.035 g
Contains
more
Mono. Fat Monounsaturated fat
+2255.6%
Contains
more
Poly. Fat Polyunsaturated fat
+3394.3%
Contains
less
Sat. Fat Saturated fat
-82.8%