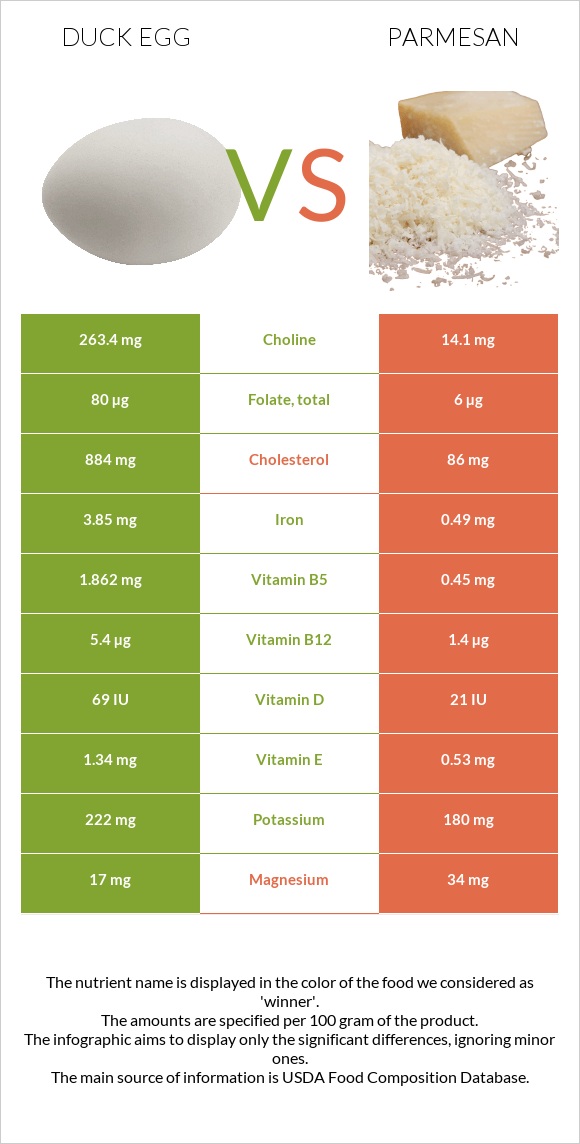
Significant differences between duck eggs and parmesan Duck eggs have more vitamin B12, choline, iron, and vitamin B5; however, parmesan is richer in calcium, phosphorus, and zinc. Duck eggs cover your daily cholesterol needs 266% more than parmesan. Parmesan has 19 times less choline than duck eggs. Duck eggs have 263.4mg of choline, while parmesan has 14.1mg. Parmesan contains less cholesterol. Specific food types used in this comparison are Egg, duck, whole, fresh, raw and Cheese, parmesan, grated .
Infographic
Mineral Comparison
Mineral comparison score is based on the number of minerals by which one or the other food is richer. The "coverage" charts below show how much of the daily needs can be covered by 300 grams of the food.
4
100 g
300 g
1 egg - 70g
Magnesium
Magnesium
Calcium
Calcium
Potassium
Potassium
Iron
Iron
Copper
Copper
Zinc
Zinc
Phosphorus
Phosphorus
Sodium
Sodium
Manganese
Manganese
Selenium
Selenium
12%
19%
20%
144%
21%
38%
94%
19%
5%
199%
5
100 g
300 g
1 tbsp - 5g 1 oz - 28.35g
Magnesium
Magnesium
Calcium
Calcium
Potassium
Potassium
Iron
Iron
Copper
Copper
Zinc
Zinc
Phosphorus
Phosphorus
Sodium
Sodium
Manganese
Manganese
Selenium
Selenium
24%
256%
16%
18%
13%
115%
269%
235%
9.3%
188%
Vitamin Comparison
Vitamin comparison score is based on the number of vitamins by which one or the other food is richer. The "coverage" charts below show how much of the daily needs can be covered by 300 grams of the food.
9
100 g
300 g
1 egg - 70g
Vitamin C
Vit. C
Vitamin D
Vit. D
Vitamin A
Vit. A
Vitamin E
Vit. E
Vitamin B1
Vit. B1
Vitamin B2
Vit. B2
Vitamin B3
Vit. B3
Vitamin B5
Vit. B5
Vitamin B6
Vit. B6
Vitamin B12
Vit. B12
Vitamin K
Vit. K
Folate
Folate
0%
26%
65%
27%
39%
93%
3.8%
112%
58%
675%
1%
60%
2
100 g
300 g
1 tbsp - 5g 1 oz - 28.35g
Vitamin C
Vit. C
Vitamin D
Vit. D
Vitamin A
Vit. A
Vitamin E
Vit. E
Vitamin B1
Vit. B1
Vitamin B2
Vit. B2
Vitamin B3
Vit. B3
Vitamin B5
Vit. B5
Vitamin B6
Vit. B6
Vitamin B12
Vit. B12
Vitamin K
Vit. K
Folate
Folate
0%
7.5%
87%
11%
6.5%
83%
1.5%
27%
19%
175%
4.3%
4.5%
All nutrients comparison - raw data values
Nutrient
DV% diff.
Cholesterol
884mg
86mg
266%
Vitamin B12
5.4µg
1.4µg
167%
Calcium
64mg
853mg
79%
Sodium
146mg
1804mg
72%
Phosphorus
220mg
627mg
58%
Saturated fat
3.681g
15.371g
53%
Choline
263.4mg
14.1mg
45%
Iron
3.85mg
0.49mg
42%
Protein
12.81g
28.42g
31%
Vitamin B5
1.862mg
0.45mg
28%
Zinc
1.41mg
4.2mg
25%
Fats
13.77g
27.84g
22%
Folate
80µg
6µg
19%
Vitamin B6
0.25mg
0.081mg
13%
Calories
185kcal
420kcal
12%
Vitamin B1
0.156mg
0.026mg
11%
Vitamin A
194µg
262µg
8%
Vitamin D*
69 IU
21 IU
6%
Vitamin D
1.7µg
0.5µg
6%
Vitamin E
1.34mg
0.53mg
5%
Carbs
1.45g
13.91g
4%
Magnesium
17mg
34mg
4%
Selenium
36.4µg
34.4µg
4%
Vitamin B2
0.404mg
0.358mg
4%
Copper
0.062mg
0.04mg
2%
Monounsaturated fat
6.525g
7.13g
2%
Potassium
222mg
180mg
1%
Manganese
0.038mg
0.071mg
1%
Vitamin B3
0.2mg
0.08mg
1%
Vitamin K
0.4µg
1.7µg
1%
Polyunsaturated fat
1.223g
1.386g
1%
Protein per 100 calories
6.9g
6.8g
N/A
Calories per 10 g protein
144kcal
148kcal
N/A
Weight per 100 calories
54g
24g
N/A
Unsaturated / Saturated Fat ratio
2.1
0.55
N/A
Net carbs
1.45g
13.91g
N/A
Sugar
0.93g
0.07g
N/A
Trans fat
0.876g
N/A
Tryptophan
0.26mg
0.383mg
0%
Threonine
0.736mg
1.075mg
0%
Isoleucine
0.598mg
1.455mg
0%
Leucine
1.097mg
2.747mg
0%
Lysine
0.951mg
2.201mg
0%
Methionine
0.576mg
0.751mg
0%
Phenylalanine
0.84mg
1.538mg
0%
Valine
0.885mg
1.865mg
0%
Histidine
0.32mg
0.806mg
0%
Omega-3 - ALA
0.102g
N/A
Omega-3 - DPA
0g
0.015g
N/A
Omega-3 - Eicosatrienoic acid
0.002g
N/A
Omega-6 - Gamma-linoleic acid
0.002g
N/A
Omega-6 - Dihomo-gamma-linoleic acid
0.026g
N/A
Omega-6 - Eicosadienoic acid
0.006g
N/A
Omega-6 - Linoleic acid
0.87g
N/A
Macronutrient Comparison
Macronutrient breakdown side-by-side comparison
1
13%
14%
71%
Protein:
12.81 g
Fats:
13.77 g
Carbs:
1.45 g
Water:
70.83 g
Other:
1.14 g
4
28%
28%
14%
23%
7%
Protein:
28.42 g
Fats:
27.84 g
Carbs:
13.91 g
Water:
22.65 g
Other:
7.18 g
Contains
more
Water Water
+212.7%
Contains
more
Protein Protein
+121.9%
Contains
more
Fats Fats
+102.2%
Contains
more
Carbs Carbs
+859.3%
Contains
more
Other Other
+529.8%
Fat Type Comparison
Fat type breakdown side-by-side comparison
1
32%
57%
11%
Saturated fat:
Sat. Fat
3.681 g
Monounsaturated fat:
Mono. Fat
6.525 g
Polyunsaturated fat:
Poly. Fat
1.223 g
2
64%
30%
6%
Saturated fat:
Sat. Fat
15.371 g
Monounsaturated fat:
Mono. Fat
7.13 g
Polyunsaturated fat:
Poly. Fat
1.386 g
Contains
less
Sat. Fat Saturated fat
-76.1%
Contains
more
Poly. Fat Polyunsaturated fat
+13.3%
~equal in
Monounsaturated fat
~7.13g