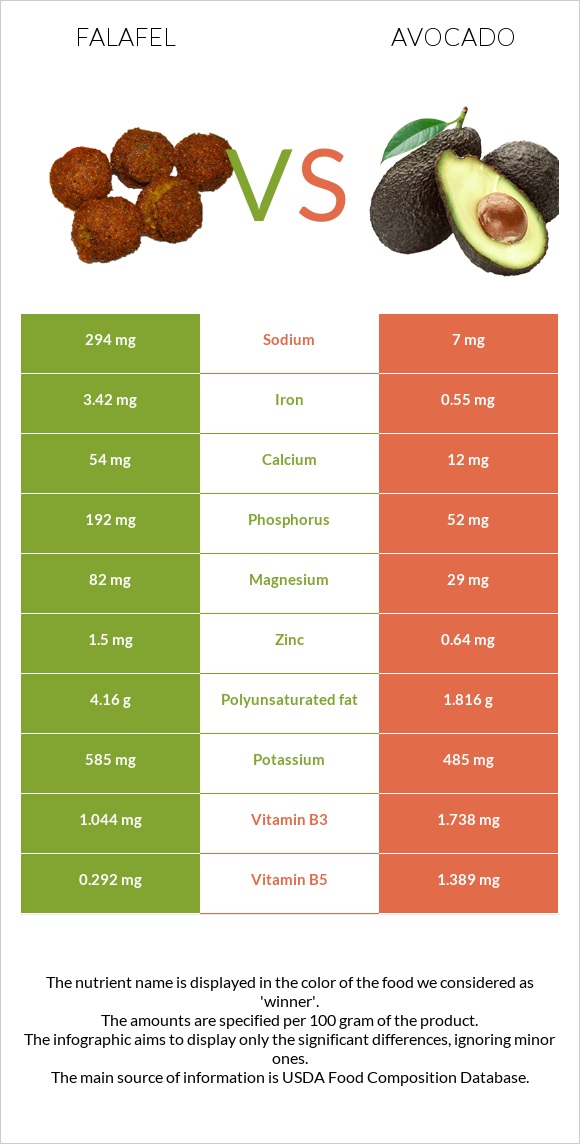
A recap on the differences between falafel and avocados Falafel is higher in iron, manganese, phosphorus, magnesium, zinc, and copper, yet avocados are higher in vitamin B5, vitamin B6, and vitamin C. Falafel covers your daily iron needs 36% more than avocados. Falafel contains 42 times more sodium than avocados. While falafel contains 294mg of sodium, avocados contain only 7mg. Food varieties used in this article are Falafel, home-prepared and Avocados, raw, all commercial varieties .
Infographic
Mineral Comparison
Mineral comparison score is based on the number of minerals by which one or the other food is richer. The "coverage" charts below show how much of the daily needs can be covered by 300 grams of the food.
9
100 g
300 g
1 patty (approx 2-1/4" dia) - 17g
Magnesium
Magnesium
Calcium
Calcium
Potassium
Potassium
Iron
Iron
Copper
Copper
Zinc
Zinc
Phosphorus
Phosphorus
Sodium
Sodium
Manganese
Manganese
Selenium
Selenium
59%
16%
52%
128%
86%
41%
82%
38%
90%
5.5%
1
100 g
300 g
1 cup, sliced - 146g 1 cup, cubes - 150g 1 avocado, NS as to Florida or California - 201g 1 cup, pureed - 230g
Magnesium
Magnesium
Calcium
Calcium
Potassium
Potassium
Iron
Iron
Copper
Copper
Zinc
Zinc
Phosphorus
Phosphorus
Sodium
Sodium
Manganese
Manganese
Selenium
Selenium
21%
3.6%
43%
21%
63%
17%
22%
0.91%
19%
2.2%
Vitamin Comparison
Vitamin comparison score is based on the number of vitamins by which one or the other food is richer. The "coverage" charts below show how much of the daily needs can be covered by 300 grams of the food.
3
100 g
300 g
1 patty (approx 2-1/4" dia) - 17g
Vitamin C
Vit. C
Vitamin D
Vit. D
Vitamin A
Vit. A
Vitamin E
Vit. E
Vitamin B1
Vit. B1
Vitamin B2
Vit. B2
Vitamin B3
Vit. B3
Vitamin B5
Vit. B5
Vitamin B6
Vit. B6
Vitamin B12
Vit. B12
Vitamin K
Vit. K
Folate
Folate
5.3%
0%
0.33%
0%
37%
38%
20%
18%
29%
0%
0%
70%
7
100 g
300 g
1 cup, sliced - 146g 1 cup, cubes - 150g 1 avocado, NS as to Florida or California - 201g 1 cup, pureed - 230g
Vitamin C
Vit. C
Vitamin D
Vit. D
Vitamin A
Vit. A
Vitamin E
Vit. E
Vitamin B1
Vit. B1
Vitamin B2
Vit. B2
Vitamin B3
Vit. B3
Vitamin B5
Vit. B5
Vitamin B6
Vit. B6
Vitamin B12
Vit. B12
Vitamin K
Vit. K
Folate
Folate
33%
0%
2.3%
41%
17%
30%
33%
83%
59%
0%
53%
61%
All nutrients comparison - raw data values
Nutrient
DV% diff.
Iron
3.42mg
0.55mg
36%
Fiber
6.7g
27%
Manganese
0.691mg
0.142mg
24%
Protein
13.31g
2g
23%
Vitamin B5
0.292mg
1.389mg
22%
Phosphorus
192mg
52mg
20%
Vitamin K
21µg
18%
Polyunsaturated fat
4.16g
1.816g
16%
Vitamin E
2.07mg
14%
Magnesium
82mg
29mg
13%
Sodium
294mg
7mg
12%
Vitamin B6
0.125mg
0.257mg
10%
Calories
333kcal
160kcal
9%
Vitamin C
1.6mg
10mg
9%
Carbs
31.84g
8.53g
8%
Copper
0.258mg
0.19mg
8%
Zinc
1.5mg
0.64mg
8%
Vitamin B1
0.146mg
0.067mg
7%
Fats
17.8g
14.66g
5%
Calcium
54mg
12mg
4%
Vitamin B3
1.044mg
1.738mg
4%
Potassium
585mg
485mg
3%
Vitamin B2
0.166mg
0.13mg
3%
Folate
93µg
81µg
3%
Choline
14.2mg
3%
Vitamin A
1µg
7µg
1%
Selenium
1µg
0.4µg
1%
Saturated fat
2.383g
2.126g
1%
Monounsaturated fat
10.171g
9.799g
1%
Protein per 100 calories
4g
1.3g
N/A
Calories per 10 g protein
250kcal
800kcal
N/A
Weight per 100 calories
30g
63g
N/A
Unsaturated / Saturated Fat ratio
6
5.5
N/A
Net carbs
31.84g
1.83g
N/A
Sugar
0.66g
N/A
Starch
0.11g
0%
Tryptophan
0.134mg
0.025mg
0%
Threonine
0.492mg
0.073mg
0%
Isoleucine
0.567mg
0.084mg
0%
Leucine
0.944mg
0.143mg
0%
Lysine
0.856mg
0.132mg
0%
Methionine
0.187mg
0.038mg
0%
Phenylalanine
0.707mg
0.097mg
0%
Valine
0.562mg
0.107mg
0%
Histidine
0.364mg
0.049mg
0%
Fructose
0.12g
0%
Omega-3 - ALA
0.111g
N/A
Omega-6 - Gamma-linoleic acid
0.015g
N/A
Macronutrient Comparison
Macronutrient breakdown side-by-side comparison
4
13%
18%
32%
35%
2%
Protein:
13.31 g
Fats:
17.8 g
Carbs:
31.84 g
Water:
34.62 g
Other:
2.43 g
1
2%
15%
9%
73%
Protein:
2 g
Fats:
14.66 g
Carbs:
8.53 g
Water:
73.23 g
Other:
1.58 g
Contains
more
Protein Protein
+565.5%
Contains
more
Fats Fats
+21.4%
Contains
more
Carbs Carbs
+273.3%
Contains
more
Other Other
+53.8%
Contains
more
Water Water
+111.5%
Fat Type Comparison
Fat type breakdown side-by-side comparison
2
14%
61%
25%
Saturated fat:
Sat. Fat
2.383 g
Monounsaturated fat:
Mono. Fat
10.171 g
Polyunsaturated fat:
Poly. Fat
4.16 g
1
15%
71%
13%
Saturated fat:
Sat. Fat
2.126 g
Monounsaturated fat:
Mono. Fat
9.799 g
Polyunsaturated fat:
Poly. Fat
1.816 g
Contains
more
Poly. Fat Polyunsaturated fat
+129.1%
Contains
less
Sat. Fat Saturated fat
-10.8%
~equal in
Monounsaturated fat
~9.799g