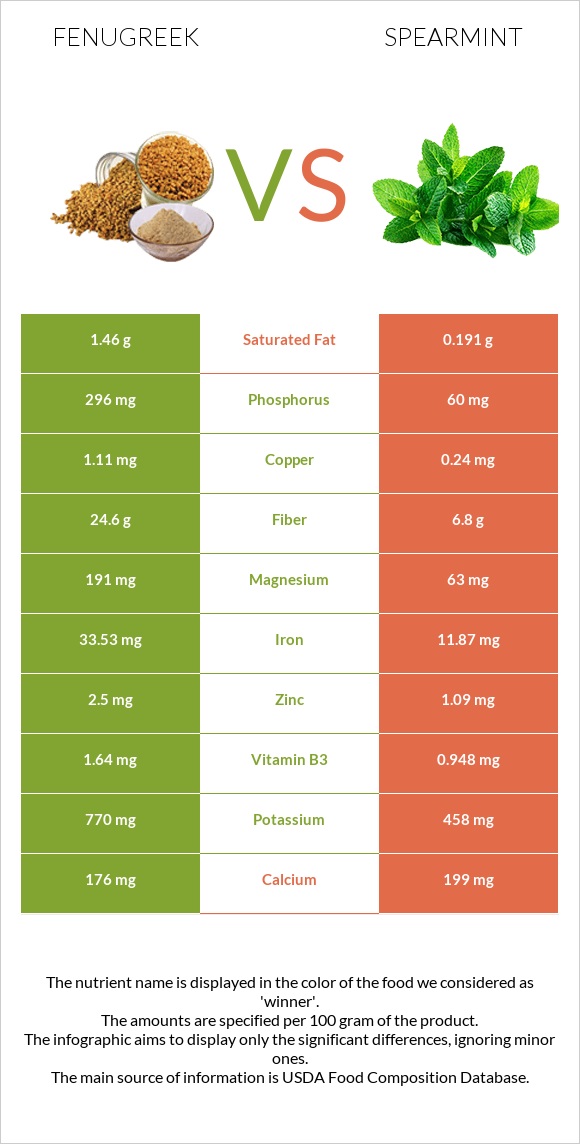
The main differences between fenugreek and spearmint Fenugreek is richer in iron, copper, fiber, vitamin B6, phosphorus, magnesium, vitamin B1, vitamin B2, and zinc, yet spearmint is richer in vitamin A. Daily need coverage for iron for fenugreek is 271% higher. Fenugreek contains 5 times more phosphorus than spearmint. Fenugreek contains 296mg of phosphorus, while spearmint contains 60mg. Food types used in this article are Spices, fenugreek seed and Spearmint, fresh .
Infographic
Mineral Comparison
Mineral comparison score is based on the number of minerals by which one or the other food is richer. The "coverage" charts below show how much of the daily needs can be covered by 300 grams of the food.
7
100 g
300 g
0.25 tsp - 0.5g 1 tbsp - 11.1g
Magnesium
Magnesium
Calcium
Calcium
Potassium
Potassium
Iron
Iron
Copper
Copper
Zinc
Zinc
Phosphorus
Phosphorus
Sodium
Sodium
Manganese
Manganese
Selenium
Selenium
136%
53%
68%
1257%
370%
68%
127%
8.7%
160%
34%
2
100 g
300 g
2 leaves - 0.3g 2 tbsp - 11.4g
Magnesium
Magnesium
Calcium
Calcium
Potassium
Potassium
Iron
Iron
Copper
Copper
Zinc
Zinc
Phosphorus
Phosphorus
Sodium
Sodium
Manganese
Manganese
Selenium
Selenium
45%
60%
40%
445%
80%
30%
26%
3.9%
146%
0%
Vitamin Comparison
Vitamin comparison score is based on the number of vitamins by which one or the other food is richer. The "coverage" charts below show how much of the daily needs can be covered by 300 grams of the food.
4
100 g
300 g
0.25 tsp - 0.5g 1 tbsp - 11.1g
Vitamin C
Vit. C
Vitamin D
Vit. D
Vitamin A
Vit. A
Vitamin E
Vit. E
Vitamin B1
Vit. B1
Vitamin B2
Vit. B2
Vitamin B3
Vit. B3
Vitamin B5
Vit. B5
Vitamin B6
Vit. B6
Vitamin B12
Vit. B12
Vitamin K
Vit. K
Folate
Folate
10%
0%
1%
0%
81%
84%
31%
0%
138%
0%
0%
43%
4
100 g
300 g
2 leaves - 0.3g 2 tbsp - 11.4g
Vitamin C
Vit. C
Vitamin D
Vit. D
Vitamin A
Vit. A
Vitamin E
Vit. E
Vitamin B1
Vit. B1
Vitamin B2
Vit. B2
Vitamin B3
Vit. B3
Vitamin B5
Vit. B5
Vitamin B6
Vit. B6
Vitamin B12
Vit. B12
Vitamin K
Vit. K
Folate
Folate
44%
0%
68%
0%
20%
40%
18%
15%
36%
0%
0%
79%
All nutrients comparison - raw data values
Nutrient
DV% diff.
Iron
33.53mg
11.87mg
271%
Copper
1.11mg
0.24mg
97%
Fiber
24.6g
6.8g
71%
Protein
23g
3.29g
39%
Phosphorus
296mg
60mg
34%
Vitamin B6
0.6mg
0.158mg
34%
Magnesium
191mg
63mg
30%
Vitamin A
3µg
203µg
22%
Vitamin B1
0.322mg
0.078mg
20%
Carbs
58.35g
8.41g
17%
Vitamin B2
0.366mg
0.175mg
15%
Calories
323kcal
44kcal
14%
Zinc
2.5mg
1.09mg
13%
Folate
57µg
105µg
12%
Vitamin C
3mg
13.3mg
11%
Selenium
6.3µg
11%
Fats
6.41g
0.73g
9%
Potassium
770mg
458mg
9%
Saturated fat
1.46g
0.191g
6%
Manganese
1.228mg
1.118mg
5%
Vitamin B5
0.25mg
5%
Vitamin B3
1.64mg
0.948mg
4%
Polyunsaturated fat
0.394g
3%
Calcium
176mg
199mg
2%
Sodium
67mg
30mg
2%
Protein per 100 calories
7.1g
7.5g
N/A
Calories per 10 g protein
140kcal
134kcal
N/A
Weight per 100 calories
31g
227g
N/A
Unsaturated / Saturated Fat ratio
0
2.2
N/A
Net carbs
33.75g
1.61g
N/A
Monounsaturated fat
0.025g
0%
Tryptophan
0.391mg
0.05mg
0%
Threonine
0.898mg
0.135mg
0%
Isoleucine
1.241mg
0.135mg
0%
Leucine
1.757mg
0.247mg
0%
Lysine
1.684mg
0.141mg
0%
Methionine
0.338mg
0.046mg
0%
Phenylalanine
1.089mg
0.168mg
0%
Valine
1.102mg
0.164mg
0%
Histidine
0.668mg
0.066mg
0%
Macronutrient Comparison
Macronutrient breakdown side-by-side comparison
4
23%
6%
58%
9%
3%
Protein:
23 g
Fats:
6.41 g
Carbs:
58.35 g
Water:
8.84 g
Other:
3.4 g
1
3%
8%
86%
2%
Protein:
3.29 g
Fats:
0.73 g
Carbs:
8.41 g
Water:
85.55 g
Other:
2.02 g
Contains
more
Protein Protein
+599.1%
Contains
more
Fats Fats
+778.1%
Contains
more
Carbs Carbs
+593.8%
Contains
more
Other Other
+68.3%
Contains
more
Water Water
+867.8%
Fat Type Comparison
Fat type breakdown side-by-side comparison
0
100%
Saturated fat:
Sat. Fat
1.46 g
Monounsaturated fat:
Mono. Fat
0 g
Polyunsaturated fat:
Poly. Fat
0 g
3
31%
4%
65%
Saturated fat:
Sat. Fat
0.191 g
Monounsaturated fat:
Mono. Fat
0.025 g
Polyunsaturated fat:
Poly. Fat
0.394 g
Contains
less
Sat. Fat Saturated fat
-86.9%