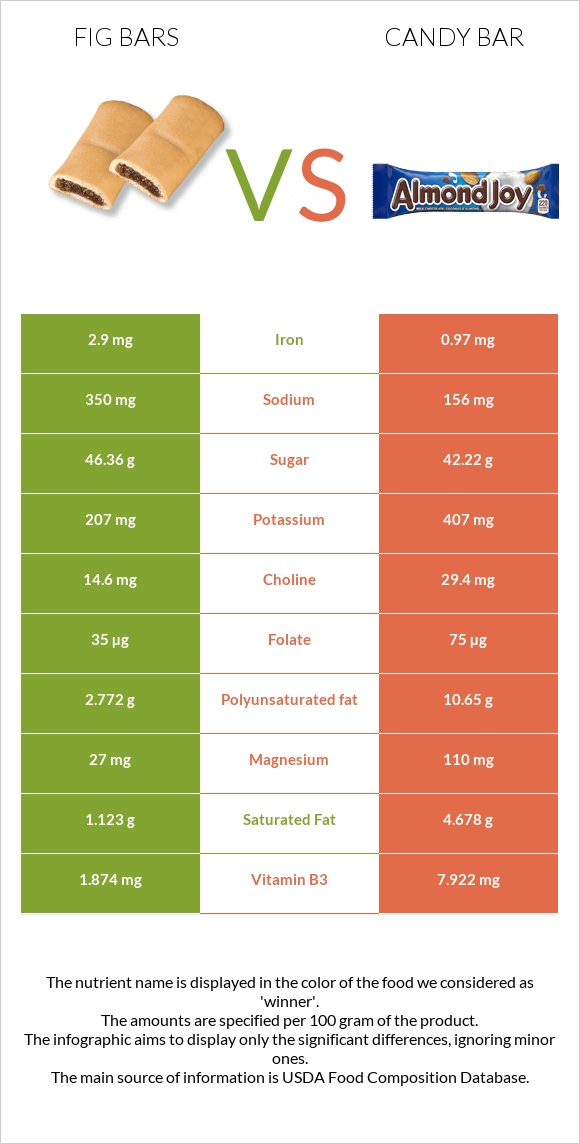
What are the differences between fig bars and candy bar? Fig bars are higher in iron, yet candy bar is higher in vitamin B6, copper, manganese, vitamin B3, phosphorus, zinc, vitamin E, and magnesium. Candy bar's daily need coverage for vitamin B6 is 11763% more. Fig bars have 3 times more iron than candy bar. While fig bars have 2.9mg of iron, candy bar has only 0.97mg. The amount of saturated fat in fig bars is lower. The glycemic index of candy bar is lower. We used Cookies, fig bars and Candies, peanut bar types in this article.
Infographic
Mineral Comparison
Mineral comparison score is based on the number of minerals by which one or the other food is richer. The "coverage" charts below show how much of the daily needs can be covered by 300 grams of the food.
1
100 g
300 g
1 cookie - 16g 1 oz - 28.35g 1 Figaroo (2 square halves) - 43g 1 individual package (2 oz package containing 2 3" bars) - 57g
Magnesium
Magnesium
Calcium
Calcium
Potassium
Potassium
Iron
Iron
Copper
Copper
Zinc
Zinc
Phosphorus
Phosphorus
Sodium
Sodium
Manganese
Manganese
Selenium
Selenium
19%
19%
18%
109%
49%
11%
27%
46%
45%
18%
9
100 g
300 g
1 oz - 28.35g 1 bar (1.4 oz) - 40g 1 bar (1.6 oz) - 45g 1 bar (1.75 fl oz) - 50g
Magnesium
Magnesium
Calcium
Calcium
Potassium
Potassium
Iron
Iron
Copper
Copper
Zinc
Zinc
Phosphorus
Phosphorus
Sodium
Sodium
Manganese
Manganese
Selenium
Selenium
79%
23%
36%
36%
258%
107%
132%
20%
162%
26%
Vitamin Comparison
Vitamin comparison score is based on the number of vitamins by which one or the other food is richer. The "coverage" charts below show how much of the daily needs can be covered by 300 grams of the food.
6
100 g
300 g
1 cookie - 16g 1 oz - 28.35g 1 Figaroo (2 square halves) - 43g 1 individual package (2 oz package containing 2 3" bars) - 57g
Vitamin C
Vit. C
Vitamin D
Vit. D
Vitamin A
Vit. A
Vitamin E
Vit. E
Vitamin B1
Vit. B1
Vitamin B2
Vit. B2
Vitamin B3
Vit. B3
Vitamin B5
Vit. B5
Vitamin B6
Vit. B6
Vitamin B12
Vit. B12
Vitamin K
Vit. K
Folate
Folate
1%
0%
3%
13%
40%
50%
35%
22%
17%
11%
15%
26%
5
100 g
300 g
1 oz - 28.35g 1 bar (1.4 oz) - 40g 1 bar (1.6 oz) - 45g 1 bar (1.75 fl oz) - 50g
Vitamin C
Vit. C
Vitamin D
Vit. D
Vitamin A
Vit. A
Vitamin E
Vit. E
Vitamin B1
Vit. B1
Vitamin B2
Vit. B2
Vitamin B3
Vit. B3
Vitamin B5
Vit. B5
Vitamin B6
Vit. B6
Vitamin B12
Vit. B12
Vitamin K
Vit. K
Folate
Folate
0%
0%
0%
82%
25%
32%
149%
50%
35308%
0%
0%
56%
All nutrients comparison - raw data values
Nutrient
DV% diff.
Vitamin B6
0.075mg
153mg
11763%
Copper
0.147mg
0.774mg
70%
Polyunsaturated fat
2.772g
10.65g
53%
Fats
7.3g
33.7g
41%
Manganese
0.343mg
1.243mg
39%
Vitamin B3
1.874mg
7.922mg
38%
Phosphorus
62mg
308mg
35%
Monounsaturated fat
3.003g
16.721g
34%
Zinc
0.39mg
3.94mg
32%
Protein
3.7g
15.5g
24%
Iron
2.9mg
0.97mg
24%
Vitamin E
0.65mg
4.1mg
23%
Magnesium
27mg
110mg
20%
Saturated fat
1.123g
4.678g
16%
Folate
35µg
75µg
10%
Calories
348kcal
522kcal
9%
Vitamin B5
0.364mg
0.83mg
9%
Carbs
70.9g
47.4g
8%
Sodium
350mg
156mg
8%
Potassium
207mg
407mg
6%
Vitamin B2
0.217mg
0.14mg
6%
Vitamin B1
0.158mg
0.1mg
5%
Vitamin K
5.8µg
0µg
5%
Vitamin B12
0.09µg
0µg
4%
Selenium
3.3µg
4.7µg
3%
Choline
14.6mg
29.4mg
3%
Fiber
4.6g
4.1g
2%
Calcium
64mg
78mg
1%
Vitamin A
9µg
0µg
1%
Protein per 100 calories
1.1g
3g
N/A
Calories per 10 g protein
941kcal
337kcal
N/A
Weight per 100 calories
29g
19g
N/A
Unsaturated / Saturated Fat ratio
5.1
5.9
N/A
Vitamin C
0.3mg
0mg
0%
Net carbs
66.3g
43.3g
N/A
Sugar
46.36g
42.22g
N/A
Tryptophan
0.046mg
0.149mg
0%
Threonine
0.113mg
0.52mg
0%
Isoleucine
0.132mg
0.534mg
0%
Leucine
0.224mg
0.986mg
0%
Lysine
0.14mg
0.545mg
0%
Methionine
0.053mg
0.185mg
0%
Phenylalanine
0.145mg
0.787mg
0%
Valine
0.155mg
0.638mg
0%
Histidine
0.067mg
0.385mg
0%
Macronutrient Comparison
Macronutrient breakdown side-by-side comparison
2
4%
7%
71%
17%
Protein:
3.7 g
Fats:
7.3 g
Carbs:
70.9 g
Water:
16.5 g
Other:
1.6 g
3
16%
34%
47%
2%
Protein:
15.5 g
Fats:
33.7 g
Carbs:
47.4 g
Water:
1.6 g
Other:
1.8 g
Contains
more
Carbs Carbs
+49.6%
Contains
more
Water Water
+931.3%
Contains
more
Protein Protein
+318.9%
Contains
more
Fats Fats
+361.6%
Contains
more
Other Other
+12.5%
Fat Type Comparison
Fat type breakdown side-by-side comparison
1
16%
44%
40%
Saturated fat:
Sat. Fat
1.123 g
Monounsaturated fat:
Mono. Fat
3.003 g
Polyunsaturated fat:
Poly. Fat
2.772 g
2
15%
52%
33%
Saturated fat:
Sat. Fat
4.678 g
Monounsaturated fat:
Mono. Fat
16.721 g
Polyunsaturated fat:
Poly. Fat
10.65 g
Contains
less
Sat. Fat Saturated fat
-76%
Contains
more
Mono. Fat Monounsaturated fat
+456.8%
Contains
more
Poly. Fat Polyunsaturated fat
+284.2%