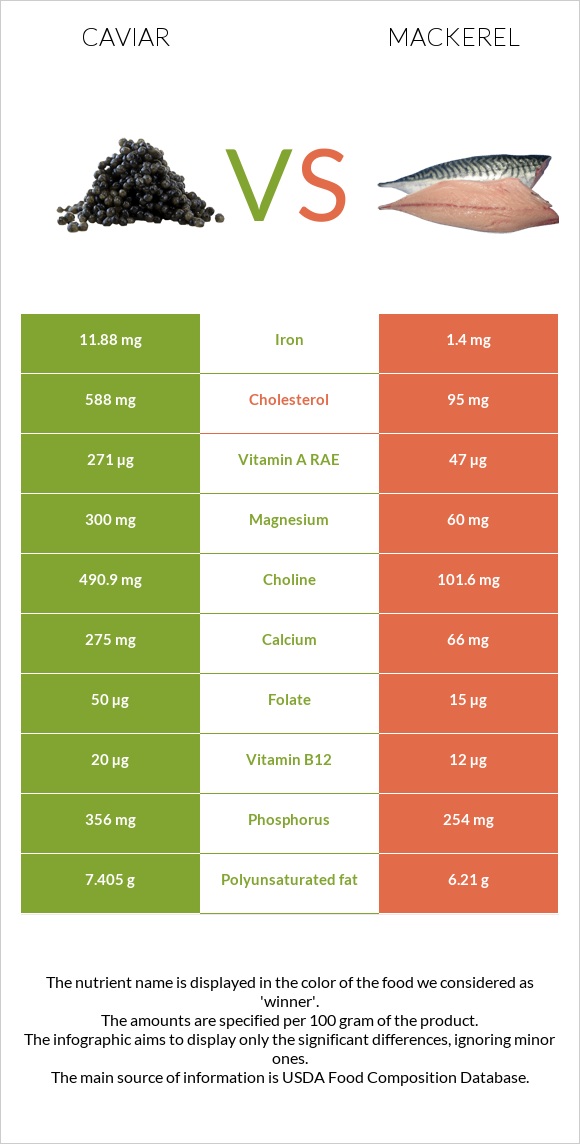
Important differences between caviar and mackerel Caviar has more vitamin B12, iron, choline, magnesium, vitamin B2, and calcium; however, mackerel is richer in vitamin D* and vitamin B3. Caviar's daily need coverage for vitamin B12 is 333% more. Caviar contains 8 times more iron than mackerel. Caviar contains 11.88mg of iron, while mackerel contains 1.4mg. Mackerel contains less cholesterol. The food varieties used in the comparison are Fish, caviar, black, and red, granular and Fish, mackerel, salted .
Infographic
Mineral Comparison
Mineral comparison score is based on the number of minerals by which one or the other food is richer. The "coverage" charts below show how much of the daily needs can be covered by 300 grams of the food.
6
100 g
300 g
1 tbsp - 16g 1 oz - 28.35g
Magnesium
Magnesium
Calcium
Calcium
Potassium
Potassium
Iron
Iron
Copper
Copper
Zinc
Zinc
Phosphorus
Phosphorus
Sodium
Sodium
Manganese
Manganese
Selenium
Selenium
214%
83%
16%
446%
37%
26%
153%
196%
6.5%
357%
3
100 g
300 g
1 cubic inch, boneless - 17g 1 piece (5-1/2" x 1-1/2" x 1/2") - 80g 1 cup, cooked - 136g
Magnesium
Magnesium
Calcium
Calcium
Potassium
Potassium
Iron
Iron
Copper
Copper
Zinc
Zinc
Phosphorus
Phosphorus
Sodium
Sodium
Manganese
Manganese
Selenium
Selenium
43%
20%
46%
53%
33%
30%
109%
580%
0%
400%
Vitamin Comparison
Vitamin comparison score is based on the number of vitamins by which one or the other food is richer. The "coverage" charts below show how much of the daily needs can be covered by 300 grams of the food.
6
100 g
300 g
1 tbsp - 16g 1 oz - 28.35g
Vitamin C
Vit. C
Vitamin D
Vit. D
Vitamin A
Vit. A
Vitamin E
Vit. E
Vitamin B1
Vit. B1
Vitamin B2
Vit. B2
Vitamin B3
Vit. B3
Vitamin B5
Vit. B5
Vitamin B6
Vit. B6
Vitamin B12
Vit. B12
Vitamin K
Vit. K
Folate
Folate
0%
44%
90%
38%
48%
143%
2.3%
210%
74%
2500%
1.5%
38%
5
100 g
300 g
1 cubic inch, boneless - 17g 1 piece (5-1/2" x 1-1/2" x 1/2") - 80g 1 cup, cooked - 136g
Vitamin C
Vit. C
Vitamin D
Vit. D
Vitamin A
Vit. A
Vitamin E
Vit. E
Vitamin B1
Vit. B1
Vitamin B2
Vit. B2
Vitamin B3
Vit. B3
Vitamin B5
Vit. B5
Vitamin B6
Vit. B6
Vitamin B12
Vit. B12
Vitamin K
Vit. K
Folate
Folate
0%
378%
16%
48%
5%
44%
62%
0%
95%
1500%
20%
11%
All nutrients comparison - raw data values
Nutrient
DV% diff.
Vitamin B12
20µg
12µg
333%
Cholesterol
588mg
95mg
164%
Iron
11.88mg
1.4mg
131%
Sodium
1500mg
4450mg
128%
Vitamin D
2.9µg
25.2µg
112%
Vitamin D*
117 IU
1006 IU
111%
Choline
490.9mg
101.6mg
71%
Vitamin B5
3.5mg
70%
Magnesium
300mg
60mg
57%
Vitamin B2
0.62mg
0.19mg
33%
Vitamin A
271µg
47µg
25%
Calcium
275mg
66mg
21%
Vitamin B3
0.12mg
3.3mg
20%
Phosphorus
356mg
254mg
15%
Selenium
65.5µg
73.4µg
14%
Vitamin B1
0.19mg
0.02mg
14%
Saturated fat
4.06g
7.148g
14%
Protein
24.6g
18.5g
12%
Fats
17.9g
25.1g
11%
Potassium
181mg
520mg
10%
Folate
50µg
15µg
9%
Monounsaturated fat
4.631g
8.32g
9%
Polyunsaturated fat
7.405g
6.21g
8%
Vitamin B6
0.32mg
0.41mg
7%
Vitamin K
0.6µg
7.8µg
6%
Vitamin E
1.89mg
2.38mg
3%
Calories
264kcal
305kcal
2%
Manganese
0.05mg
2%
Carbs
4g
0g
1%
Copper
0.11mg
0.1mg
1%
Zinc
0.95mg
1.1mg
1%
Protein per 100 calories
9.3g
6.1g
N/A
Calories per 10 g protein
107kcal
165kcal
N/A
Weight per 100 calories
38g
33g
N/A
Unsaturated / Saturated Fat ratio
3
2
N/A
Net carbs
4g
0g
N/A
Tryptophan
0.323mg
0%
Threonine
1.263mg
0%
Isoleucine
1.035mg
0%
Leucine
2.133mg
0%
Lysine
1.834mg
0%
Methionine
0.646mg
0%
Phenylalanine
1.071mg
0%
Valine
1.263mg
0%
Histidine
0.649mg
0%
Omega-3 - EPA
2.741g
1.619g
N/A
Omega-3 - DHA
3.8g
2.965g
N/A
Omega-3 - DPA
0.229g
0.391g
N/A
Macronutrient Comparison
Macronutrient breakdown side-by-side comparison
3
25%
18%
4%
48%
6%
Protein:
24.6 g
Fats:
17.9 g
Carbs:
4 g
Water:
47.5 g
Other:
6 g
2
19%
25%
43%
13%
Protein:
18.5 g
Fats:
25.1 g
Carbs:
0 g
Water:
43 g
Other:
13.4 g
Contains
more
Protein Protein
+33%
Contains
more
Carbs Carbs
+∞%
Contains
more
Fats Fats
+40.2%
Contains
more
Other Other
+123.3%
Fat Type Comparison
Fat type breakdown side-by-side comparison
2
25%
29%
46%
Saturated fat:
Sat. Fat
4.06 g
Monounsaturated fat:
Mono. Fat
4.631 g
Polyunsaturated fat:
Poly. Fat
7.405 g
1
33%
38%
29%
Saturated fat:
Sat. Fat
7.148 g
Monounsaturated fat:
Mono. Fat
8.32 g
Polyunsaturated fat:
Poly. Fat
6.21 g
Contains
less
Sat. Fat Saturated fat
-43.2%
Contains
more
Poly. Fat Polyunsaturated fat
+19.2%
Contains
more
Mono. Fat Monounsaturated fat
+79.7%