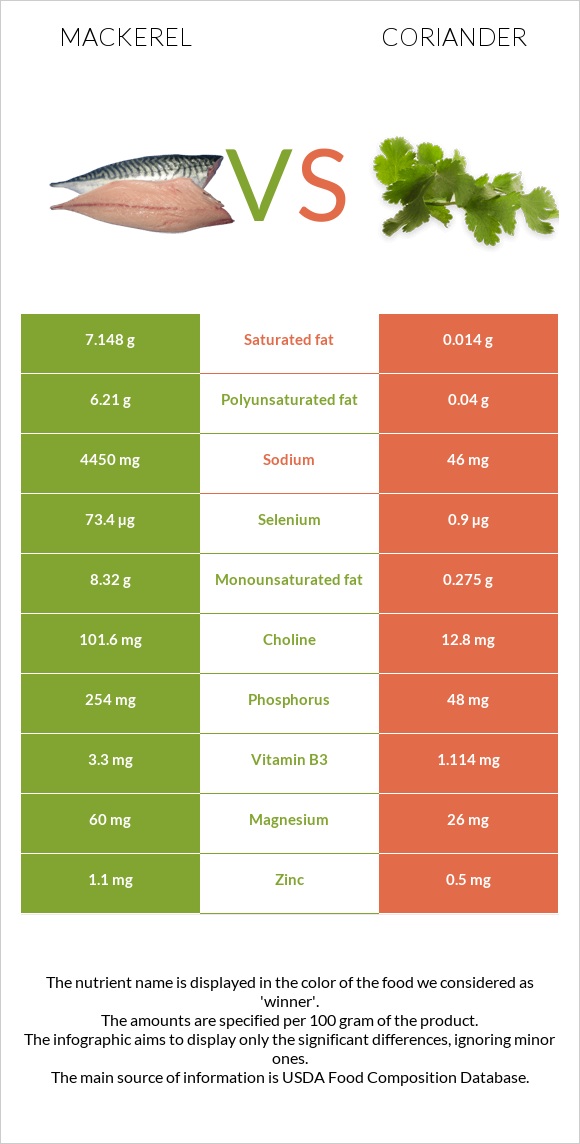
A recap on the differences between mackerel and coriander Mackerel has more vitamin B12, selenium, vitamin D*, protein, and fats; however, coriander is higher in vitamin K and vitamin A. Mackerel covers your daily vitamin B12 needs 500% more than coriander. Coriander has less cholesterol. The glycemic index of coriander is higher. Food varieties used in this article are Fish, mackerel, salted and Coriander (cilantro) leaves, raw .
Infographic
Mineral Comparison
The mineral comparison score is based on which food has a more favorable amount of each mineral. The �coverage� charts below show how much of the daily mineral needs are covered by the selected amount of each food.
4
100 g
300 g
1 cubic inch, boneless - 17g 1 piece (5-1/2" x 1-1/2" x 1/2") - 80g 1 cup, cooked - 136g
Magnesium
Magnesium
Calcium
Calcium
Potassium
Potassium
Iron
Iron
Copper
Copper
Zinc
Zinc
Phosphorus
Phosphorus
Sodium
Sodium
Manganese
Manganese
Selenium
Selenium
43%
20%
46%
53%
33%
30%
109%
580%
0%
400%
4
100 g
300 g
0.25 cup - 4g 9 sprigs - 20g
Magnesium
Magnesium
Calcium
Calcium
Potassium
Potassium
Iron
Iron
Copper
Copper
Zinc
Zinc
Phosphorus
Phosphorus
Sodium
Sodium
Manganese
Manganese
Selenium
Selenium
19%
20%
46%
66%
75%
14%
21%
6%
56%
4.9%
Vitamin Comparison
The vitamin comparison score is based on the number of vitamins in which one food is richer than the other. The �coverage� charts below show how much of the daily vitamin needs are covered by the selected amount of each food.
5
100 g
300 g
1 cubic inch, boneless - 17g 1 piece (5-1/2" x 1-1/2" x 1/2") - 80g 1 cup, cooked - 136g
Vitamin C
Vit. C
Vitamin D
Vit. D
Vitamin A
Vit. A
Vitamin E
Vit. E
Vitamin B1
Vit. B1
Vitamin B2
Vit. B2
Vitamin B3
Vit. B3
Vitamin B5
Vit. B5
Vitamin B6
Vit. B6
Vitamin B12
Vit. B12
Vitamin K
Vit. K
Folate
Folate
0%
378%
16%
48%
5%
44%
62%
0%
95%
1500%
20%
11%
6
100 g
300 g
0.25 cup - 4g 9 sprigs - 20g
Vitamin C
Vit. C
Vitamin D
Vit. D
Vitamin A
Vit. A
Vitamin E
Vit. E
Vitamin B1
Vit. B1
Vitamin B2
Vit. B2
Vitamin B3
Vit. B3
Vitamin B5
Vit. B5
Vitamin B6
Vit. B6
Vitamin B12
Vit. B12
Vitamin K
Vit. K
Folate
Folate
90%
0%
112%
50%
17%
37%
21%
34%
34%
0%
775%
47%
All nutrients comparison - raw data values
Nutrient
DV% diff.
Vitamin B12
12µg
0µg
500%
Vitamin K
7.8µg
310µg
252%
Sodium
4450mg
46mg
191%
Selenium
73.4µg
0.9µg
132%
Vitamin D*
1006 IU
0 IU
126%
Vitamin D
25.2µg
0µg
126%
Polyunsaturated fat
6.21g
0.04g
41%
Fats
25.1g
0.52g
38%
Protein
18.5g
2.13g
33%
Cholesterol
95mg
0mg
32%
Vitamin A
47µg
337µg
32%
Saturated fat
7.148g
0.014g
32%
Vitamin C
0mg
27mg
30%
Phosphorus
254mg
48mg
29%
Vitamin B6
0.41mg
0.149mg
20%
Monounsaturated fat
8.32g
0.275g
20%
Manganese
0.426mg
19%
Choline
101.6mg
12.8mg
16%
Calories
305kcal
23kcal
14%
Copper
0.1mg
0.225mg
14%
Vitamin B3
3.3mg
1.114mg
14%
Folate
15µg
62µg
12%
Fiber
0g
2.8g
11%
Vitamin B5
0.57mg
11%
Magnesium
60mg
26mg
8%
Iron
1.4mg
1.77mg
5%
Zinc
1.1mg
0.5mg
5%
Vitamin B1
0.02mg
0.067mg
4%
Vitamin B2
0.19mg
0.162mg
2%
Carbs
0g
3.67g
1%
Vitamin E
2.38mg
2.5mg
1%
Protein per 100 calories
6.1g
9.3g
N/A
Calories per 10 g protein
165kcal
108kcal
N/A
Weight per 100 calories
33g
435g
N/A
Unsaturated / Saturated Fat ratio
2
23
N/A
Net carbs
0g
0.87g
N/A
Calcium
66mg
67mg
0%
Potassium
520mg
521mg
0%
Sugar
0g
0.87g
N/A
Omega-3 (EPA)
1.619g
0g
N/A
Omega-3 (DHA)
2.965g
0g
N/A
Omega-3 (DPA)
0.391g
0g
N/A
Macronutrient Comparison
Macronutrient breakdown side-by-side comparison
2
19%
25%
43%
13%
Protein:
18.5 g
Fats:
25.1 g
Carbs:
0 g
Water:
43 g
Other:
13.4 g
2
2%
4%
92%
Protein:
2.13 g
Fats:
0.52 g
Carbs:
3.67 g
Water:
92.21 g
Other:
1.47 g
Contains
more
Protein Protein
+768.5%
Contains
more
Fats Fats
+4726.9%
Contains
more
Carbs Carbs
+∞%
Contains
more
Water Water
+114.4%
Fat Type Comparison
Fat type breakdown side-by-side comparison
2
33%
38%
29%
Saturated fat:
Sat. Fat
7.148 g
Monounsaturated fat:
Mono. Fat
8.32 g
Polyunsaturated fat:
Poly. Fat
6.21 g
1
4%
84%
12%
Saturated fat:
Sat. Fat
0.014 g
Monounsaturated fat:
Mono. Fat
0.275 g
Polyunsaturated fat:
Poly. Fat
0.04 g
Contains
more
Mono. Fat Monounsaturated fat
+2925.5%
Contains
more
Poly. Fat Polyunsaturated fat
+15425%
Contains
less
Sat. Fat Saturated fat
-99.8%