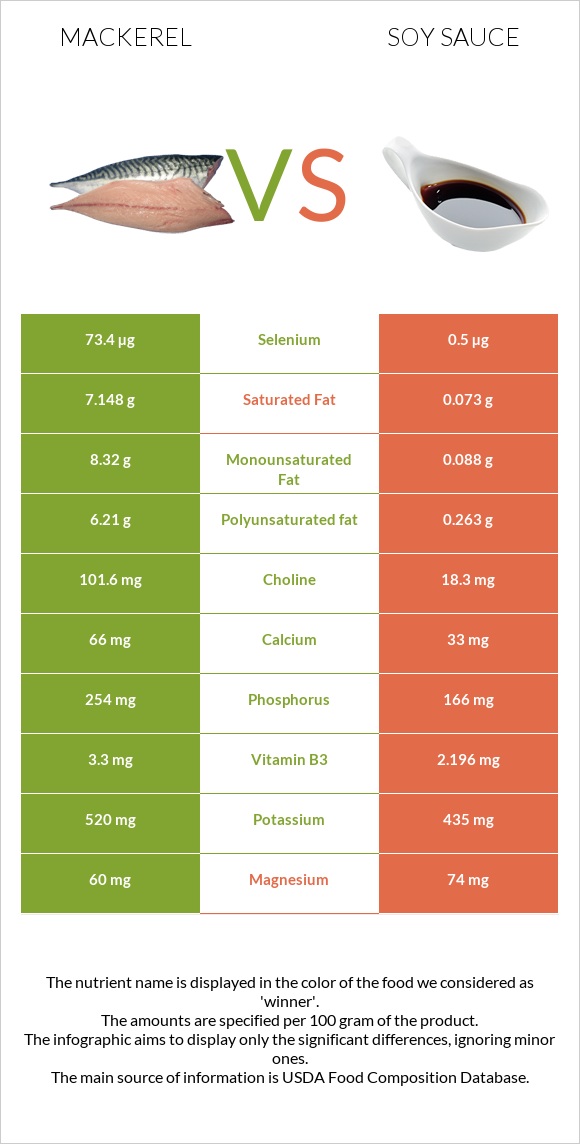
Summary of differences between mackerel and soy sauce The amount of vitamin B12, selenium, vitamin D*, vitamin B6, vitamin E, choline, and phosphorus in mackerel is higher than in soy sauce. Mackerel covers your daily need for vitamin B12, 500% more than soy sauce. The amount of cholesterol in soy sauce is lower. Mackerel has a lower glycemic index. The glycemic index of mackerel is 0, while the glycemic index of soy sauce is 15. These are the specific foods used in this comparison Fish, mackerel, salted and Soy sauce made from soy and wheat (shoyu) .
Infographic
Mineral Comparison
Mineral comparison score is based on the number of minerals by which one or the other food is richer. The "coverage" charts below show how much of the daily needs can be covered by 300 grams of the food.
7
100 g
300 g
1 cubic inch, boneless - 17g 1 piece (5-1/2" x 1-1/2" x 1/2") - 80g 1 cup, cooked - 136g
Magnesium
Magnesium
Calcium
Calcium
Potassium
Potassium
Iron
Iron
Copper
Copper
Zinc
Zinc
Phosphorus
Phosphorus
Sodium
Sodium
Manganese
Manganese
Selenium
Selenium
43%
20%
46%
53%
33%
30%
109%
580%
0%
400%
2
100 g
300 g
1 tsp - 5.3g 1 individual packet - 8.9g 1 tbsp - 16g 1 cup - 255g
Magnesium
Magnesium
Calcium
Calcium
Potassium
Potassium
Iron
Iron
Copper
Copper
Zinc
Zinc
Phosphorus
Phosphorus
Sodium
Sodium
Manganese
Manganese
Selenium
Selenium
53%
9.9%
38%
54%
14%
24%
71%
716%
133%
2.7%
Vitamin Comparison
Vitamin comparison score is based on the number of vitamins by which one or the other food is richer. The "coverage" charts below show how much of the daily needs can be covered by 300 grams of the food.
8
100 g
300 g
1 cubic inch, boneless - 17g 1 piece (5-1/2" x 1-1/2" x 1/2") - 80g 1 cup, cooked - 136g
Vitamin C
Vit. C
Vitamin D
Vit. D
Vitamin A
Vit. A
Vitamin E
Vit. E
Vitamin B1
Vit. B1
Vitamin B2
Vit. B2
Vitamin B3
Vit. B3
Vitamin B5
Vit. B5
Vitamin B6
Vit. B6
Vitamin B12
Vit. B12
Vitamin K
Vit. K
Folate
Folate
0%
378%
16%
48%
5%
44%
62%
0%
95%
1500%
20%
11%
2
100 g
300 g
1 tsp - 5.3g 1 individual packet - 8.9g 1 tbsp - 16g 1 cup - 255g
Vitamin C
Vit. C
Vitamin D
Vit. D
Vitamin A
Vit. A
Vitamin E
Vit. E
Vitamin B1
Vit. B1
Vitamin B2
Vit. B2
Vitamin B3
Vit. B3
Vitamin B5
Vit. B5
Vitamin B6
Vit. B6
Vitamin B12
Vit. B12
Vitamin K
Vit. K
Folate
Folate
0%
0%
0%
0%
8.3%
38%
41%
18%
34%
0%
0%
11%
All nutrients comparison - raw data values
Nutrient
DV% diff.
Vitamin B12
12µg
0µg
500%
Selenium
73.4µg
0.5µg
133%
Vitamin D*
1006 IU
0 IU
126%
Vitamin D
25.2µg
0µg
126%
Sodium
4450mg
5493mg
45%
Manganese
1.018mg
44%
Polyunsaturated fat
6.21g
0.263g
40%
Fats
25.1g
0.57g
38%
Cholesterol
95mg
0mg
32%
Saturated fat
7.148g
0.073g
32%
Protein
18.5g
8.14g
21%
Monounsaturated fat
8.32g
0.088g
21%
Vitamin B6
0.41mg
0.148mg
20%
Vitamin E
2.38mg
0mg
16%
Choline
101.6mg
18.3mg
15%
Calories
305kcal
53kcal
13%
Phosphorus
254mg
166mg
13%
Vitamin B3
3.3mg
2.196mg
7%
Vitamin K
7.8µg
0µg
7%
Copper
0.1mg
0.043mg
6%
Vitamin B5
0.297mg
6%
Vitamin A
47µg
0µg
5%
Magnesium
60mg
74mg
3%
Calcium
66mg
33mg
3%
Potassium
520mg
435mg
3%
Fiber
0g
0.8g
3%
Carbs
0g
4.93g
2%
Zinc
1.1mg
0.87mg
2%
Vitamin B2
0.19mg
0.165mg
2%
Iron
1.4mg
1.45mg
1%
Vitamin B1
0.02mg
0.033mg
1%
Protein per 100 calories
6.1g
15g
N/A
Calories per 10 g protein
165kcal
65kcal
N/A
Weight per 100 calories
33g
189g
N/A
Unsaturated / Saturated Fat ratio
2
4.8
N/A
Net carbs
0g
4.13g
N/A
Sugar
0g
0.4g
N/A
Folate
15µg
14µg
0%
Tryptophan
0.096mg
0%
Threonine
0.271mg
0%
Isoleucine
0.318mg
0%
Leucine
0.537mg
0%
Lysine
0.381mg
0%
Methionine
0.097mg
0%
Phenylalanine
0.353mg
0%
Valine
0.332mg
0%
Histidine
0.174mg
0%
Omega-3 - EPA
1.619g
0g
N/A
Omega-3 - DHA
2.965g
0g
N/A
Omega-3 - DPA
0.391g
0g
N/A
Macronutrient Comparison
Macronutrient breakdown side-by-side comparison
2
19%
25%
43%
13%
Protein:
18.5 g
Fats:
25.1 g
Carbs:
0 g
Water:
43 g
Other:
13.4 g
3
8%
5%
71%
15%
Protein:
8.14 g
Fats:
0.57 g
Carbs:
4.93 g
Water:
71.15 g
Other:
15.21 g
Contains
more
Protein Protein
+127.3%
Contains
more
Fats Fats
+4303.5%
Contains
more
Carbs Carbs
+∞%
Contains
more
Water Water
+65.5%
Contains
more
Other Other
+13.5%
Fat Type Comparison
Fat type breakdown side-by-side comparison
2
33%
38%
29%
Saturated fat:
Sat. Fat
7.148 g
Monounsaturated fat:
Mono. Fat
8.32 g
Polyunsaturated fat:
Poly. Fat
6.21 g
1
17%
21%
62%
Saturated fat:
Sat. Fat
0.073 g
Monounsaturated fat:
Mono. Fat
0.088 g
Polyunsaturated fat:
Poly. Fat
0.263 g
Contains
more
Mono. Fat Monounsaturated fat
+9354.5%
Contains
more
Poly. Fat Polyunsaturated fat
+2261.2%
Contains
less
Sat. Fat Saturated fat
-99%