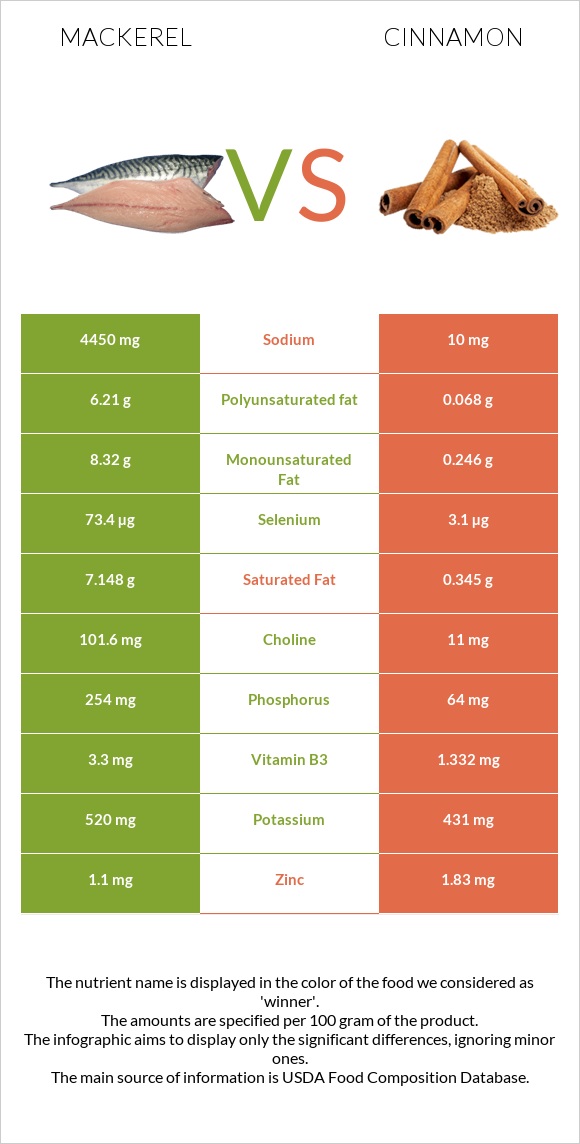
Significant differences between mackerel and cinnamon Mackerel is richer in vitamin B12, selenium, vitamin D* and phosphorus, while cinnamon is higher in fiber, calcium, and iron. Mackerel covers your daily vitamin B12 needs 500% more than cinnamon. Cinnamon is lower in cholesterol. Specific food types used in this comparison are Fish, mackerel, salted and Spices, cinnamon, ground .
Infographic
Mineral Comparison
Mineral comparison score is based on the number of minerals by which one or the other food is richer. The "coverage" charts below show how much of the daily needs can be covered by 300 grams of the food.
3
100 g
300 g
1 cubic inch, boneless - 17g 1 piece (5-1/2" x 1-1/2" x 1/2") - 80g 1 cup, cooked - 136g
Magnesium
Magnesium
Calcium
Calcium
Potassium
Potassium
Iron
Iron
Copper
Copper
Zinc
Zinc
Phosphorus
Phosphorus
Sodium
Sodium
Manganese
Manganese
Selenium
Selenium
43%
20%
46%
53%
33%
30%
109%
580%
0%
400%
6
100 g
300 g
0.25 tsp - 0.5g 1 tbsp - 7.8g
Magnesium
Magnesium
Calcium
Calcium
Potassium
Potassium
Iron
Iron
Copper
Copper
Zinc
Zinc
Phosphorus
Phosphorus
Sodium
Sodium
Manganese
Manganese
Selenium
Selenium
43%
301%
38%
312%
113%
50%
27%
1.3%
2278%
17%
Vitamin Comparison
Vitamin comparison score is based on the number of vitamins by which one or the other food is richer. The "coverage" charts below show how much of the daily needs can be covered by 300 grams of the food.
7
100 g
300 g
1 cubic inch, boneless - 17g 1 piece (5-1/2" x 1-1/2" x 1/2") - 80g 1 cup, cooked - 136g
Vitamin C
Vit. C
Vitamin D
Vit. D
Vitamin A
Vit. A
Vitamin E
Vit. E
Vitamin B1
Vit. B1
Vitamin B2
Vit. B2
Vitamin B3
Vit. B3
Vitamin B5
Vit. B5
Vitamin B6
Vit. B6
Vitamin B12
Vit. B12
Vitamin K
Vit. K
Folate
Folate
0%
378%
16%
48%
5%
44%
62%
0%
95%
1500%
20%
11%
3
100 g
300 g
0.25 tsp - 0.5g 1 tbsp - 7.8g
Vitamin C
Vit. C
Vitamin D
Vit. D
Vitamin A
Vit. A
Vitamin E
Vit. E
Vitamin B1
Vit. B1
Vitamin B2
Vit. B2
Vitamin B3
Vit. B3
Vitamin B5
Vit. B5
Vitamin B6
Vit. B6
Vitamin B12
Vit. B12
Vitamin K
Vit. K
Folate
Folate
13%
0%
5%
46%
5.5%
9.5%
25%
21%
36%
0%
78%
4.5%
All nutrients comparison - raw data values
Nutrient
DV% diff.
Manganese
17.466mg
759%
Vitamin B12
12µg
0µg
500%
Fiber
0g
53.1g
212%
Sodium
4450mg
10mg
193%
Selenium
73.4µg
3.1µg
128%
Vitamin D*
1006 IU
0 IU
126%
Vitamin D
25.2µg
0µg
126%
Calcium
66mg
1002mg
94%
Iron
1.4mg
8.32mg
87%
Polyunsaturated fat
6.21g
0.068g
41%
Fats
25.1g
1.24g
37%
Cholesterol
95mg
0mg
32%
Saturated fat
7.148g
0.345g
31%
Protein
18.5g
3.99g
29%
Carbs
0g
80.59g
27%
Copper
0.1mg
0.339mg
27%
Phosphorus
254mg
64mg
27%
Vitamin K
7.8µg
31.2µg
20%
Monounsaturated fat
8.32g
0.246g
20%
Vitamin B6
0.41mg
0.158mg
19%
Choline
101.6mg
11mg
16%
Vitamin B3
3.3mg
1.332mg
12%
Vitamin B2
0.19mg
0.041mg
11%
Zinc
1.1mg
1.83mg
7%
Vitamin B5
0.358mg
7%
Vitamin C
0mg
3.8mg
4%
Vitamin A
47µg
15µg
4%
Calories
305kcal
247kcal
3%
Potassium
520mg
431mg
3%
Folate
15µg
6µg
2%
Fructose
1.11g
1%
Protein per 100 calories
6.1g
1.6g
N/A
Calories per 10 g protein
165kcal
619kcal
N/A
Weight per 100 calories
33g
40g
N/A
Unsaturated / Saturated Fat ratio
2
0.91
N/A
Net carbs
0g
27.49g
N/A
Magnesium
60mg
60mg
0%
Sugar
0g
2.17g
N/A
Vitamin E
2.38mg
2.32mg
0%
Vitamin B1
0.02mg
0.022mg
0%
Tryptophan
0.049mg
0%
Threonine
0.136mg
0%
Isoleucine
0.146mg
0%
Leucine
0.253mg
0%
Lysine
0.243mg
0%
Methionine
0.078mg
0%
Phenylalanine
0.146mg
0%
Valine
0.224mg
0%
Histidine
0.117mg
0%
Omega-3 - EPA
1.619g
0g
N/A
Omega-3 - DHA
2.965g
0g
N/A
Omega-3 - ALA
0.011g
N/A
Omega-3 - DPA
0.391g
0g
N/A
Macronutrient Comparison
Macronutrient breakdown side-by-side comparison
4
19%
25%
43%
13%
Protein:
18.5 g
Fats:
25.1 g
Carbs:
0 g
Water:
43 g
Other:
13.4 g
1
4%
81%
11%
4%
Protein:
3.99 g
Fats:
1.24 g
Carbs:
80.59 g
Water:
10.58 g
Other:
3.6 g
Contains
more
Protein Protein
+363.7%
Contains
more
Fats Fats
+1924.2%
Contains
more
Water Water
+306.4%
Contains
more
Other Other
+272.2%
Contains
more
Carbs Carbs
+∞%
Fat Type Comparison
Fat type breakdown side-by-side comparison
2
33%
38%
29%
Saturated fat:
Sat. Fat
7.148 g
Monounsaturated fat:
Mono. Fat
8.32 g
Polyunsaturated fat:
Poly. Fat
6.21 g
1
52%
37%
10%
Saturated fat:
Sat. Fat
0.345 g
Monounsaturated fat:
Mono. Fat
0.246 g
Polyunsaturated fat:
Poly. Fat
0.068 g
Contains
more
Mono. Fat Monounsaturated fat
+3282.1%
Contains
more
Poly. Fat Polyunsaturated fat
+9032.4%
Contains
less
Sat. Fat Saturated fat
-95.2%