Mackerel vs. Herring — Health Impact and Nutrition Comparison


Summary
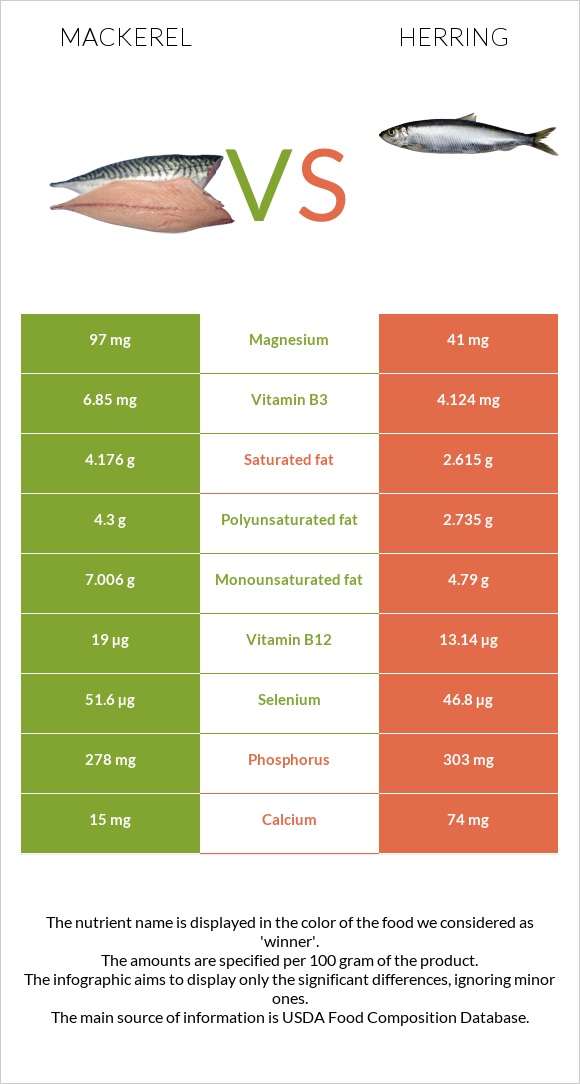
Mackerel is high in magnesium, selenium, and vitamins A, B2, B3, B5, and B12. Mackerel also contains more monounsaturated and polyunsaturated fats. Unlike mackerel, herring has higher calcium, choline, potassium, vitamins D, E, and folate. Herring has less saturated fats, whereas mackerel has lower sodium content.
Introduction
Herring is a small-headed fish with a silvery iridescent side and a deep blue, metallic-colored back. Mackerel has a rounded and torpedo-shaped body, a forked tail, and a series of tiny finlets behind the dorsal and anal fins. The color of Atlantic mackerel is pale champagne with a greenish hue.
The length of Atlantic mackerel is 16 ½ inches, and the weight is 2.2 pounds. Atlantic herring is 10-12 inches long and weighs around half a pound.
Classification
Herring belongs to the order Clupeiformes and the family Clupeidae. Mackerel, on the other hand, belongs to the order Perciformes and the family Scombridae.
Taste
Almost every type of mackerel has a particular flavor. The flesh is wet, flaky, and delicate. Many people praise these fish for their somewhat sweet and salty.
Herring has a unique, fatty flavor. Many people describe them as deep and full-bodied. It has a smooth, flaky texture and a subtle saltiness that complements many sauces and seasonings.
Varieties
Mackerel has more than 30 types. The most common are Atlantic, King, and Spanish mackerels. There are several types of herring. The common types are Atlantic, Pacific, Blueback, and Shad.
Nutrition
The nutritional information below concerns mackerel, Atlantic, cooked, dry heat, and herring, Atlantic, cooked, dry heat.
Macronutrients and Calories
Mackerel and herring contain equal amounts of protein and are carb-free. In comparison to herring, mackerel has more monounsaturated and polyunsaturated fats. Furthermore, mackerel has more calories per hundred grams.
Macronutrient Comparison
Contains
more
FatsFats
+53.7%
Contains
more
OtherOther
+315.6%
Contains
more
WaterWater
+20.4%
Calories
Compared to herring, mackerel has more calories per hundred grams. A hundred grams of mackerel contains 262 calories, whereas herring provides 203 calories.
The serving size of mackerel and herring is one fillet.
Calories in one fillet or 88 grams for mackerel is 230kcal. One fillet of herring weighs 143 grams and has 290 kcal.
Protein
Mackerel and herring contain equal amounts of protein. The protein contents for mackerel and herring are 23.85g and 23.03g, respectively. Both provide all essential amino acids in small quantities.
Fats
Compared to herring, mackerel is higher in fats. A hundred grams of mackerel contains 17.81g of fat. Unlike it, herring has only 11.59g. Mackerel is high in monounsaturated and polyunsaturated fats. Herring, on the other hand, contains over two times less saturated fats.
Fat Type Comparison
Contains
more
Mono. FatMonounsaturated fat
+46.3%
Contains
more
Poly. FatPolyunsaturated fat
+57.2%
Contains
less
Sat. FatSaturated fat
-37.4%
Omega-3 fatty acids
Compared to mackerel, herring has two times more omega-3 fatty acids. Herring is high in omega-3 DHA and EPA, whereas mackerel is high in omega-3 DPA.
Carbohydrates
Mackerel and herring are carb-free.
Vitamins
Mackerel is high in vitamins B2, B3, B5, B12, and A. On the other hand, herring contains more vitamins D, E, C, and folate.
Vitamin Comparison
Contains
more
Vitamin AVitamin A
+50%
Contains
more
Vitamin B1Vitamin B1
+42%
Contains
more
Vitamin B2Vitamin B2
+37.8%
Contains
more
Vitamin B3Vitamin B3
+66.1%
Contains
more
Vitamin B5Vitamin B5
+33.8%
Contains
more
Vitamin B6Vitamin B6
+32.2%
Contains
more
Vitamin B12Vitamin B12
+44.6%
Contains
more
Vitamin CVitamin C
+75%
Contains
more
FolateFolate
+500%
Minerals
Mackerel contains more magnesium and selenium. Moreover, mackerel provides less sodium. A hundred grams of mackerel has 83mg of sodium, whereas herring has 115mg.
Herring is high in calcium and phosphorus. Herring also contains 83.3mg of choline, whereas mackerel does not.
Mineral Comparison
Contains
more
MagnesiumMagnesium
+136.6%
Contains
more
IronIron
+11.3%
Contains
less
SodiumSodium
-27.8%
Contains
more
CalciumCalcium
+393.3%
Contains
more
CopperCopper
+25.5%
Contains
more
ZincZinc
+35.1%
Contains
more
ManganeseManganese
+100%
Mercury Level
The mercury concentration mean (PPM) for Atlantic mackerel is 0.05. Herring has a mercury concentration mean (PPM) of 0.078. Herring has a higher mercury level than Atlantic mackerel.
Compared to other types of mackerel, Atlantic mackerel has a lower PPM(0.05), whereas King mackerel has a higher PPM(0.73)(1).
Glycemic Index
Mackerel and herring do not contain carbohydrates and are low glycemic index foods. The glycemic index of both foods is 0.
Acidity
The potential renal acid load (PRAL) is a method for determining the acidity of food. The PRAL value of mackerel is 10.8. The PRAL value of the herring is 11.7. Both of them are acidic.
Health Impact
Cardiovascular Health
Oily fish have cardioprotective properties. In individuals with established coronary heart disease, omega-3 fatty acids may lower the risk of sudden cardiac death and overall mortality(2).
Even a low-dose consumption of mackerel and herring may successfully control modestly high blood pressure over an extended length of time(3).
Consuming oily fish such as salmon, herring, and pompano can significantly raise the level of n-3 LC-PUFA in serum. According to the study, herring consumption may also reduce blood levels of TAG, apoB, apoCII, apoCIII, and TNF-α and increase serum levels of adiponectin(4).
According to the study, mackerel consumption may reduce the level of VLDL and LDL. It also increases HDL/total plasma cholesterol ratio(5).
Diabetes
The findings do not suggest a protective impact of fish consumption or EPA and DHA intake on the incidence of type 2 diabetes(6).
However, for people with diabetes, fish rich in omega-3 fatty acids is a suitable option(7).
Pregnancy
While pregnant, seafood may be a regular part of your healthy eating plan as long as you avoid fish that are high in mercury. Atlantic mackerel and herring are the best choices for pregnant women. Unlike it, they must avoid king mackerel, which is high in mercury(8).
Moreover, fish consumption rich in omega-3 fatty acids is associated with embryonic development, including immunological, neural, and retinal function(9).
Cancer
There was insufficient data to support the impact of omega-3 fatty acids on cancer risk. Weak evidence supports the link between omega-3 fatty acids and breast cancer, hepatocellular carcinoma, prostate cancer, and brain tumors(10).
Sources
- https://www.fda.gov/food/
- https://pubmed.ncbi.nlm.nih.gov/25720716/
- https://pubmed.ncbi.nlm.nih.gov/2189040/
- https://pubmed.ncbi.nlm.nih.gov/22221492/
- https://pubmed.ncbi.nlm.nih.gov/3239108/
- https://www.ncbi.nlm.nih.gov/pmc/articles/PMC2768220/
- https://diabetes.org/healthy-living
- https://www.fda.gov/food/
- https://pubmed.ncbi.nlm.nih.gov/22332096/
- https://www.ncbi.nlm.nih.gov/pmc/articles/PMC7490175/

Infographic
All nutrients comparison - raw data values
| Nutrient | |
|
DV% diff. |
| Vitamin B12 | 19µg | 13.14µg | 244% |
| Vitamin D* | 214 IU | 27% | |
| Vitamin D | 5.4µg | 27% | |
| Vitamin B3 | 6.85mg | 4.124mg | 17% |
| Choline | 83.3mg | 15% | |
| Magnesium | 97mg | 41mg | 13% |
| Fats | 17.81g | 11.59g | 10% |
| Polyunsaturated fat | 4.3g | 2.735g | 10% |
| Vitamin E | 1.37mg | 9% | |
| Selenium | 51.6µg | 46.8µg | 9% |
| Vitamin B2 | 0.412mg | 0.299mg | 9% |
| Vitamin B6 | 0.46mg | 0.348mg | 9% |
| Saturated fat | 4.176g | 2.615g | 7% |
| Calcium | 15mg | 74mg | 6% |
| Monounsaturated fat | 7.006g | 4.79g | 6% |
| Vitamin B5 | 0.99mg | 0.74mg | 5% |
| Phosphorus | 278mg | 303mg | 4% |
| Vitamin B1 | 0.159mg | 0.112mg | 4% |
| Calories | 262kcal | 203kcal | 3% |
| Copper | 0.094mg | 0.118mg | 3% |
| Zinc | 0.94mg | 1.27mg | 3% |
| Folate | 2µg | 12µg | 3% |
| Protein | 23.85g | 23.03g | 2% |
| Iron | 1.57mg | 1.41mg | 2% |
| Vitamin A | 54µg | 36µg | 2% |
| Cholesterol | 75mg | 77mg | 1% |
| Potassium | 401mg | 419mg | 1% |
| Sodium | 83mg | 115mg | 1% |
| Manganese | 0.02mg | 0.04mg | 1% |
| Protein per 100 calories | 9.1g | 11g | N/A |
| Calories per 10 g protein | 110kcal | 88kcal | N/A |
| Weight per 100 calories | 38g | 49g | N/A |
| Unsaturated / Saturated Fat ratio | 2.7 | 2.9 | N/A |
| Vitamin C | 0.4mg | 0.7mg | 0% |
| Vitamin K | 0.1µg | 0% | |
| Tryptophan | 0.267mg | 0.258mg | 0% |
| Threonine | 1.045mg | 1.01mg | 0% |
| Isoleucine | 1.099mg | 1.061mg | 0% |
| Leucine | 1.938mg | 1.872mg | 0% |
| Lysine | 2.19mg | 2.115mg | 0% |
| Methionine | 0.706mg | 0.682mg | 0% |
| Phenylalanine | 0.931mg | 0.899mg | 0% |
| Valine | 1.228mg | 1.187mg | 0% |
| Histidine | 0.702mg | 0.678mg | 0% |
| Omega-3 - EPA | 0.504g | 0.909g | N/A |
| Omega-3 - DHA | 0.699g | 1.105g | N/A |
| Omega-3 - DPA | 0.106g | 0.071g | N/A |
People also compare


References
All the values for which the sources are not specified explicitly are taken from FDA’s Food Central. The exact link to the food presented on this page can be found below.
- Mackerel - https://fdc.nal.usda.gov/fdc-app.html#/food-details/175120/nutrients
- Herring - https://fdc.nal.usda.gov/fdc-app.html#/food-details/175117/nutrients
All the Daily Values are presented for males aged 31-50, for 2000-calorie diets.