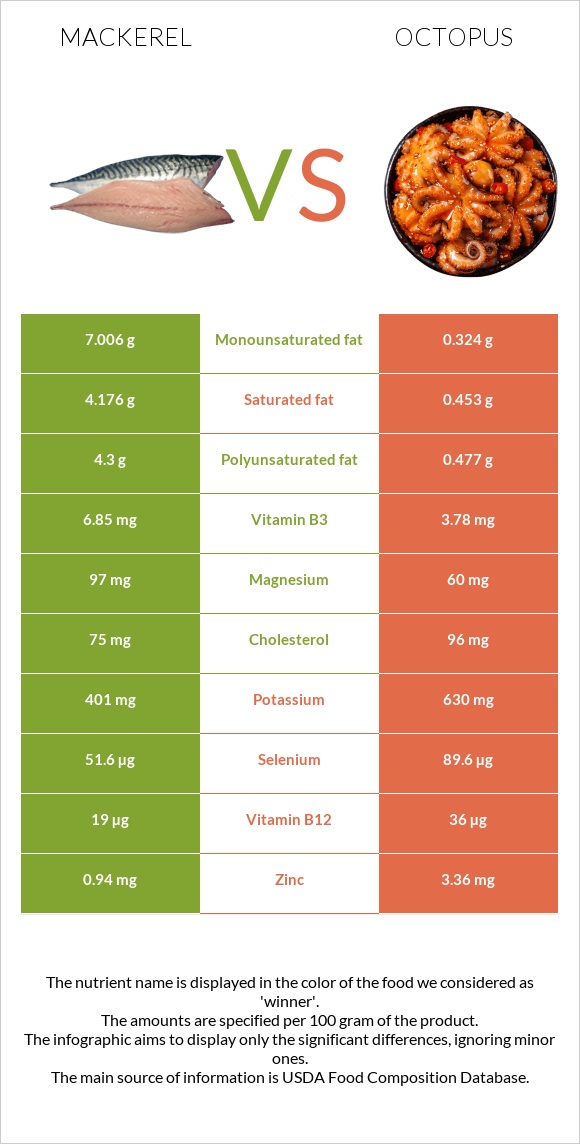
What are the differences between mackerel and octopus? Mackerel is higher in vitamin B2 and vitamin B3, yet octopus is higher in vitamin B12, iron, copper, selenium, zinc, and vitamin B6. Octopus's daily need coverage for vitamin B12 is 708% more. Mackerel has 9 times more saturated fat than octopus. While mackerel has 4.176g of saturated fat, octopus has only 0.453g. We used Fish, mackerel, Atlantic, cooked, dry heat and Mollusks, octopus, common, cooked, moist heat types in this article.
Infographic
Mineral Comparison
Mineral comparison score is based on the number of minerals by which one or the other food is richer. The "coverage" charts below show how much of the daily needs can be covered by 300 grams of the food.
2
100 g
300 g
3 oz - 85g 1 fillet - 88g
Magnesium
Magnesium
Calcium
Calcium
Potassium
Potassium
Iron
Iron
Copper
Copper
Zinc
Zinc
Phosphorus
Phosphorus
Sodium
Sodium
Manganese
Manganese
Selenium
Selenium
69%
4.5%
35%
59%
31%
26%
119%
11%
2.6%
281%
7
100 g
300 g
3 oz - 85g
Magnesium
Magnesium
Calcium
Calcium
Potassium
Potassium
Iron
Iron
Copper
Copper
Zinc
Zinc
Phosphorus
Phosphorus
Sodium
Sodium
Manganese
Manganese
Selenium
Selenium
43%
32%
56%
358%
246%
92%
120%
60%
6.1%
489%
Vitamin Comparison
Vitamin comparison score is based on the number of vitamins by which one or the other food is richer. The "coverage" charts below show how much of the daily needs can be covered by 300 grams of the food.
3
100 g
300 g
3 oz - 85g 1 fillet - 88g
Vitamin C
Vit. C
Vitamin D
Vit. D
Vitamin A
Vit. A
Vitamin E
Vit. E
Vitamin B1
Vit. B1
Vitamin B2
Vit. B2
Vitamin B3
Vit. B3
Vitamin B5
Vit. B5
Vitamin B6
Vit. B6
Vitamin B12
Vit. B12
Vitamin K
Vit. K
Folate
Folate
1.3%
0%
18%
0%
40%
95%
128%
59%
106%
2375%
0%
1.5%
7
100 g
300 g
3 oz - 85g
Vitamin C
Vit. C
Vitamin D
Vit. D
Vitamin A
Vit. A
Vitamin E
Vit. E
Vitamin B1
Vit. B1
Vitamin B2
Vit. B2
Vitamin B3
Vit. B3
Vitamin B5
Vit. B5
Vitamin B6
Vit. B6
Vitamin B12
Vit. B12
Vitamin K
Vit. K
Folate
Folate
27%
0%
30%
24%
14%
18%
71%
54%
150%
4500%
0.25%
18%
All nutrients comparison - raw data values
Nutrient
DV% diff.
Vitamin B12
19µg
36µg
708%
Iron
1.57mg
9.54mg
100%
Copper
0.094mg
0.739mg
72%
Selenium
51.6µg
89.6µg
69%
Vitamin B2
0.412mg
0.076mg
26%
Polyunsaturated fat
4.3g
0.477g
25%
Fats
17.81g
2.08g
24%
Zinc
0.94mg
3.36mg
22%
Vitamin B3
6.85mg
3.78mg
19%
Saturated fat
4.176g
0.453g
17%
Monounsaturated fat
7.006g
0.324g
17%
Sodium
83mg
460mg
16%
Choline
81mg
15%
Vitamin B6
0.46mg
0.648mg
14%
Protein
23.85g
29.82g
12%
Magnesium
97mg
60mg
9%
Calcium
15mg
106mg
9%
Vitamin B1
0.159mg
0.057mg
9%
Vitamin C
0.4mg
8mg
8%
Vitamin E
1.2mg
8%
Cholesterol
75mg
96mg
7%
Potassium
401mg
630mg
7%
Folate
2µg
24µg
6%
Calories
262kcal
164kcal
5%
Vitamin A
54µg
90µg
4%
Vitamin B5
0.99mg
0.9mg
2%
Carbs
0g
4.4g
1%
Manganese
0.02mg
0.047mg
1%
Protein per 100 calories
9.1g
18g
N/A
Calories per 10 g protein
110kcal
55kcal
N/A
Weight per 100 calories
38g
61g
N/A
Unsaturated / Saturated Fat ratio
2.7
1.8
N/A
Net carbs
0g
4.4g
N/A
Phosphorus
278mg
279mg
0%
Vitamin K
0.1µg
0%
Tryptophan
0.267mg
0.334mg
0%
Threonine
1.045mg
1.283mg
0%
Isoleucine
1.099mg
1.298mg
0%
Leucine
1.938mg
2.099mg
0%
Lysine
2.19mg
2.228mg
0%
Methionine
0.706mg
0.673mg
0%
Phenylalanine
0.931mg
1.069mg
0%
Valine
1.228mg
1.303mg
0%
Histidine
0.702mg
0.573mg
0%
Omega-3 - EPA
0.504g
0.152g
N/A
Omega-3 - DHA
0.699g
0.162g
N/A
Omega-3 - DPA
0.106g
0.012g
N/A
Macronutrient Comparison
Macronutrient breakdown side-by-side comparison
2
24%
18%
53%
5%
Protein:
23.85 g
Fats:
17.81 g
Carbs:
0 g
Water:
53.27 g
Other:
5.07 g
3
30%
2%
4%
61%
3%
Protein:
29.82 g
Fats:
2.08 g
Carbs:
4.4 g
Water:
60.5 g
Other:
3.2 g
Contains
more
Fats Fats
+756.3%
Contains
more
Other Other
+58.4%
Contains
more
Protein Protein
+25%
Contains
more
Carbs Carbs
+∞%
Contains
more
Water Water
+13.6%
Fat Type Comparison
Fat type breakdown side-by-side comparison
2
27%
45%
28%
Saturated fat:
Sat. Fat
4.176 g
Monounsaturated fat:
Mono. Fat
7.006 g
Polyunsaturated fat:
Poly. Fat
4.3 g
1
36%
26%
38%
Saturated fat:
Sat. Fat
0.453 g
Monounsaturated fat:
Mono. Fat
0.324 g
Polyunsaturated fat:
Poly. Fat
0.477 g
Contains
more
Mono. Fat Monounsaturated fat
+2062.3%
Contains
more
Poly. Fat Polyunsaturated fat
+801.5%
Contains
less
Sat. Fat Saturated fat
-89.2%