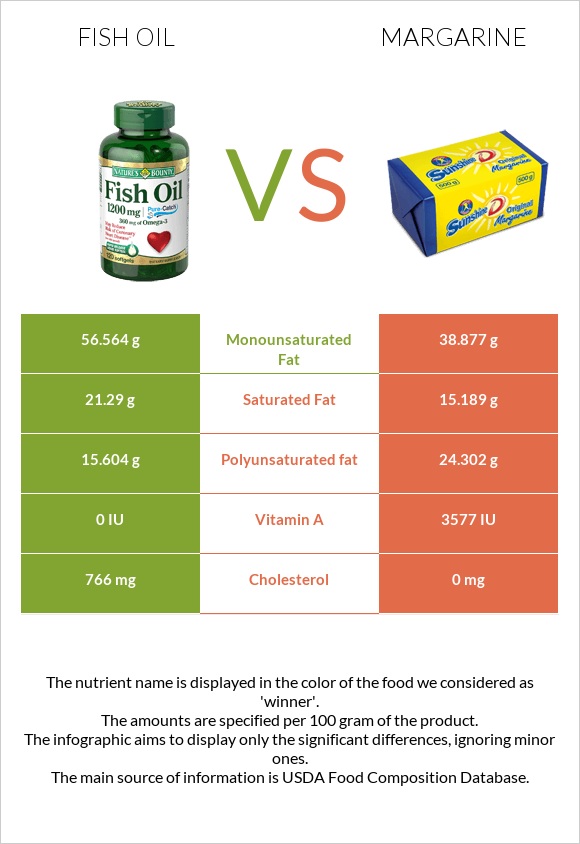
Differences between fish oil and margarine Fish oil has more vitamin D* and polyunsaturated fat, while margarine has more vitamin A and monounsaturated fat. Fish oil's daily need coverage for cholesterol is 237% higher. The amount of cholesterol in margarine is lower. The food types used in this comparison are Fish oil, sardine and Margarine, regular, 80% fat, composite, stick, without salt .
Infographic
Mineral Comparison
Mineral comparison score is based on the number of minerals by which one or the other food is richer. The "coverage" charts below show how much of the daily needs can be covered by 300 grams of the food.
1
100 g
300 g
1 tsp - 4.5g 1 tbsp - 13.6g 1 cup - 218g
Magnesium
Magnesium
Calcium
Calcium
Potassium
Potassium
Iron
Iron
Copper
Copper
Zinc
Zinc
Phosphorus
Phosphorus
Sodium
Sodium
Manganese
Manganese
Selenium
Selenium
0%
0%
0%
0%
0%
0%
0%
0%
0%
0%
5
100 g
300 g
1 pat (1" sq, 1/3" high) - 5g 1 tbsp - 14.2g 1 stick - 113g 1 cup - 227g
Magnesium
Magnesium
Calcium
Calcium
Potassium
Potassium
Iron
Iron
Copper
Copper
Zinc
Zinc
Phosphorus
Phosphorus
Sodium
Sodium
Manganese
Manganese
Selenium
Selenium
2.1%
0.9%
1.6%
2.3%
0%
0%
2.1%
0.26%
0%
0%
Vitamin Comparison
Vitamin comparison score is based on the number of vitamins by which one or the other food is richer. The "coverage" charts below show how much of the daily needs can be covered by 300 grams of the food.
1
100 g
300 g
1 tsp - 4.5g 1 tbsp - 13.6g 1 cup - 218g
Vitamin C
Vit. C
Vitamin D
Vit. D
Vitamin A
Vit. A
Vitamin E
Vit. E
Vitamin B1
Vit. B1
Vitamin B2
Vit. B2
Vitamin B3
Vit. B3
Vitamin B5
Vit. B5
Vitamin B6
Vit. B6
Vitamin B12
Vit. B12
Vitamin K
Vit. K
Folate
Folate
0%
125%
0%
0%
0%
0%
0%
0%
0%
0%
0%
0%
10
100 g
300 g
1 pat (1" sq, 1/3" high) - 5g 1 tbsp - 14.2g 1 stick - 113g 1 cup - 227g
Vitamin C
Vit. C
Vitamin D
Vit. D
Vitamin A
Vit. A
Vitamin E
Vit. E
Vitamin B1
Vit. B1
Vitamin B2
Vit. B2
Vitamin B3
Vit. B3
Vitamin B5
Vit. B5
Vitamin B6
Vit. B6
Vitamin B12
Vit. B12
Vitamin K
Vit. K
Folate
Folate
0.67%
0%
273%
180%
2.5%
8.5%
0.43%
0%
2.1%
13%
233%
0.75%
All nutrients comparison - raw data values
Nutrient
DV% diff.
Cholesterol
710mg
0mg
237%
Vitamin A
0µg
819µg
91%
Vitamin K
93µg
78%
Saturated fat
29.892g
15.189g
67%
Vitamin E
9mg
60%
Polyunsaturated fat
31.867g
24.302g
50%
Vitamin D*
332 IU
0 IU
42%
Vitamin D
8.3µg
0µg
42%
Fats
100g
80.71g
30%
Monounsaturated fat
33.841g
38.877g
13%
Calories
902kcal
717kcal
9%
Vitamin B12
0µg
0.1µg
4%
Vitamin B2
0mg
0.037mg
3%
Choline
12.4mg
2%
Magnesium
0mg
3mg
1%
Potassium
0mg
18mg
1%
Iron
0mg
0.06mg
1%
Phosphorus
0mg
5mg
1%
Vitamin B1
0mg
0.01mg
1%
Vitamin B6
0mg
0.009mg
1%
Protein
0g
0.16g
0%
Weight per 100 calories
11g
14g
N/A
Unsaturated / Saturated Fat ratio
2.2
4.2
N/A
Vitamin C
0mg
0.2mg
0%
Net carbs
0g
0.7g
N/A
Carbs
0g
0.7g
0%
Calcium
0mg
3mg
0%
Sodium
0mg
2mg
0%
Vitamin B3
0mg
0.023mg
0%
Folate
0µg
1µg
0%
Trans fat
14.89g
N/A
Omega-3 - EPA
10.137g
0g
N/A
Omega-3 - DHA
10.656g
0g
N/A
Omega-3 - DPA
1.973g
0.006g
N/A
Omega-6 - Linoleic acid
21.522g
N/A
Macronutrient Comparison
Macronutrient breakdown side-by-side comparison
1
100%
Protein:
0 g
Fats:
100 g
Carbs:
0 g
Water:
0 g
Other:
0 g
4
81%
17%
2%
Protein:
0.16 g
Fats:
80.71 g
Carbs:
0.7 g
Water:
16.52 g
Other:
1.91 g
Contains
more
Fats Fats
+23.9%
Contains
more
Protein Protein
+∞%
Contains
more
Carbs Carbs
+∞%
Contains
more
Water Water
+∞%
Contains
more
Other Other
+∞%
Fat Type Comparison
Fat type breakdown side-by-side comparison
1
31%
35%
33%
Saturated fat:
Sat. Fat
29.892 g
Monounsaturated fat:
Mono. Fat
33.841 g
Polyunsaturated fat:
Poly. Fat
31.867 g
2
19%
50%
31%
Saturated fat:
Sat. Fat
15.189 g
Monounsaturated fat:
Mono. Fat
38.877 g
Polyunsaturated fat:
Poly. Fat
24.302 g
Contains
more
Poly. Fat Polyunsaturated fat
+31.1%
Contains
less
Sat. Fat Saturated fat
-49.2%
Contains
more
Mono. Fat Monounsaturated fat
+14.9%