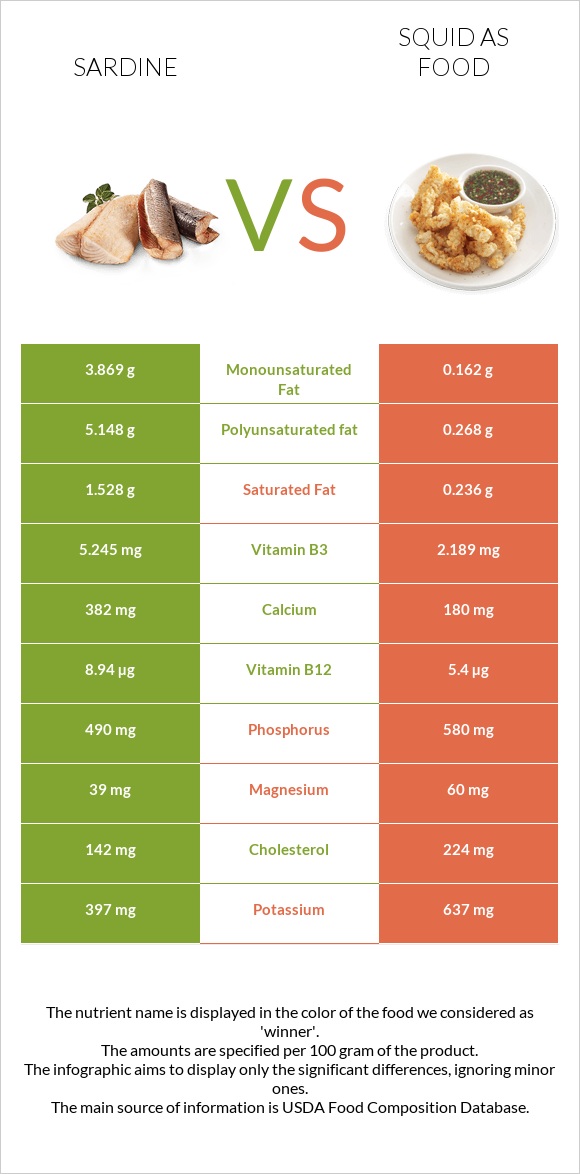
What are the differences between sardines and squid? Sardines are higher in vitamin B12, calcium, and vitamin B3; however, squid is richer in vitamin B2, iron, copper, selenium, and zinc. Sardines' daily need coverage for vitamin B12 is 148% more. Squid contains 2 times less vitamin B3 than sardines. Sardines contain 5.245mg of vitamin B3, while squid contains 2.189mg. Sardines have less cholesterol. We used Fish, sardine, Atlantic, canned in oil, drained solids with bone and Mollusks, cuttlefish, mixed species, cooked, moist heat types in this article.
Infographic
Mineral Comparison
Mineral comparison score is based on the number of minerals by which one or the other food is richer. The "coverage" charts below show how much of the daily needs can be covered by 300 grams of the food.
2
100 g
300 g
1 small (2-2/3" x 1/2" x 1/4") - 12g 1 cubic inch - 16g 2 sardines - 24g 1 oz - 28.35g 1 can (3.75 oz) - 92g 1 cup, drained - 149g
Magnesium
Magnesium
Calcium
Calcium
Potassium
Potassium
Iron
Iron
Copper
Copper
Zinc
Zinc
Phosphorus
Phosphorus
Sodium
Sodium
Manganese
Manganese
Selenium
Selenium
28%
115%
35%
110%
62%
36%
210%
40%
14%
287%
8
100 g
300 g
3 oz - 85g
Magnesium
Magnesium
Calcium
Calcium
Potassium
Potassium
Iron
Iron
Copper
Copper
Zinc
Zinc
Phosphorus
Phosphorus
Sodium
Sodium
Manganese
Manganese
Selenium
Selenium
43%
54%
56%
407%
333%
94%
249%
97%
27%
489%
Vitamin Comparison
Vitamin comparison score is based on the number of vitamins by which one or the other food is richer. The "coverage" charts below show how much of the daily needs can be covered by 300 grams of the food.
6
100 g
300 g
1 small (2-2/3" x 1/2" x 1/4") - 12g 1 cubic inch - 16g 2 sardines - 24g 1 oz - 28.35g 1 can (3.75 oz) - 92g 1 cup, drained - 149g
Vitamin C
Vit. C
Vitamin D
Vit. D
Vitamin A
Vit. A
Vitamin E
Vit. E
Vitamin B1
Vit. B1
Vitamin B2
Vit. B2
Vitamin B3
Vit. B3
Vitamin B5
Vit. B5
Vitamin B6
Vit. B6
Vitamin B12
Vit. B12
Vitamin K
Vit. K
Folate
Folate
0%
72%
11%
41%
20%
52%
98%
39%
39%
1118%
6.5%
7.5%
6
100 g
300 g
3 oz - 85g
Vitamin C
Vit. C
Vitamin D
Vit. D
Vitamin A
Vit. A
Vitamin E
Vit. E
Vitamin B1
Vit. B1
Vitamin B2
Vit. B2
Vitamin B3
Vit. B3
Vitamin B5
Vit. B5
Vitamin B6
Vit. B6
Vitamin B12
Vit. B12
Vitamin K
Vit. K
Folate
Folate
28%
0%
68%
0%
4.3%
399%
41%
54%
62%
675%
0%
18%
All nutrients comparison - raw data values
Nutrient
DV% diff.
Vitamin B12
8.94µg
5.4µg
148%
Vitamin B2
0.227mg
1.729mg
116%
Iron
2.92mg
10.84mg
99%
Copper
0.186mg
0.998mg
90%
Selenium
52.7µg
89.6µg
67%
Polyunsaturated fat
5.148g
0.268g
33%
Cholesterol
142mg
224mg
27%
Vitamin D*
193 IU
24%
Vitamin D
4.8µg
24%
Calcium
382mg
180mg
20%
Zinc
1.31mg
3.46mg
20%
Sodium
307mg
744mg
19%
Vitamin A
32µg
203µg
19%
Vitamin B3
5.245mg
2.189mg
19%
Protein
24.62g
32.48g
16%
Fats
11.45g
1.4g
15%
Vitamin E
2.04mg
14%
Choline
75mg
14%
Phosphorus
490mg
580mg
13%
Vitamin C
0mg
8.5mg
9%
Monounsaturated fat
3.869g
0.162g
9%
Vitamin B6
0.167mg
0.27mg
8%
Potassium
397mg
637mg
7%
Saturated fat
1.528g
0.236g
6%
Magnesium
39mg
60mg
5%
Vitamin B1
0.08mg
0.017mg
5%
Vitamin B5
0.642mg
0.9mg
5%
Manganese
0.108mg
0.209mg
4%
Folate
10µg
24µg
4%
Calories
208kcal
158kcal
3%
Vitamin K
2.6µg
2%
Carbs
0g
1.64g
1%
Protein per 100 calories
12g
21g
N/A
Calories per 10 g protein
84kcal
49kcal
N/A
Weight per 100 calories
48g
63g
N/A
Unsaturated / Saturated Fat ratio
5.9
1.8
N/A
Net carbs
0g
1.64g
N/A
Tryptophan
0.276mg
0.364mg
0%
Threonine
1.079mg
1.398mg
0%
Isoleucine
1.134mg
1.414mg
0%
Leucine
2.001mg
2.287mg
0%
Lysine
2.26mg
2.427mg
0%
Methionine
0.729mg
0.733mg
0%
Phenylalanine
0.961mg
1.164mg
0%
Valine
1.268mg
1.419mg
0%
Histidine
0.725mg
0.624mg
0%
Omega-3 - EPA
0.473g
0.078g
N/A
Omega-3 - DHA
0.509g
0.132g
N/A
Omega-3 - DPA
0g
0.012g
N/A
Macronutrient Comparison
Macronutrient breakdown side-by-side comparison
2
25%
11%
60%
4%
Protein:
24.62 g
Fats:
11.45 g
Carbs:
0 g
Water:
59.61 g
Other:
4.32 g
3
32%
61%
3%
Protein:
32.48 g
Fats:
1.4 g
Carbs:
1.64 g
Water:
61.12 g
Other:
3.36 g
Contains
more
Fats Fats
+717.9%
Contains
more
Other Other
+28.6%
Contains
more
Protein Protein
+31.9%
Contains
more
Carbs Carbs
+∞%
Fat Type Comparison
Fat type breakdown side-by-side comparison
2
14%
37%
49%
Saturated fat:
Sat. Fat
1.528 g
Monounsaturated fat:
Mono. Fat
3.869 g
Polyunsaturated fat:
Poly. Fat
5.148 g
1
35%
24%
40%
Saturated fat:
Sat. Fat
0.236 g
Monounsaturated fat:
Mono. Fat
0.162 g
Polyunsaturated fat:
Poly. Fat
0.268 g
Contains
more
Mono. Fat Monounsaturated fat
+2288.3%
Contains
more
Poly. Fat Polyunsaturated fat
+1820.9%
Contains
less
Sat. Fat Saturated fat
-84.6%