Salmon vs. Shrimp — Health Impact and Nutrition Comparison


Summary
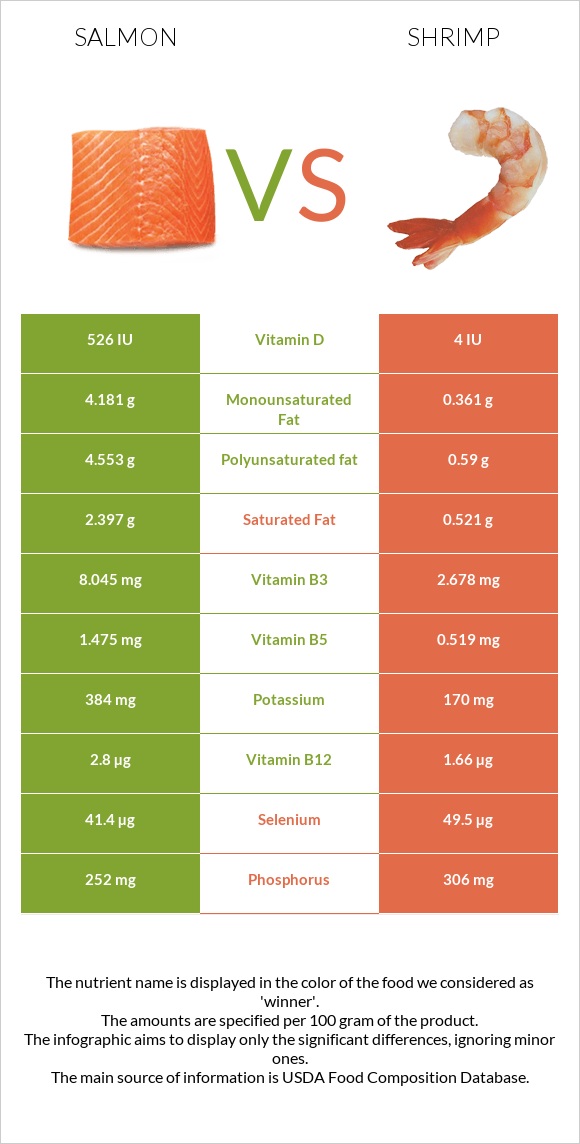
Shrimp is richer in vitamin E, selenium, choline, phosphorus, zinc, calcium, magnesium, and copper. Salmon is richer in omega-3 fats, vitamin B complex, vitamin D, and potassium. Salmon is higher in calories, and total fats, and shrimp are higher in sodium.
Introduction
The salmon is an anadromous type of fish, meaning that part of their life cycle is in saltwater, and the other is in freshwater. Salmon is one of the healthiest fish in the culinary world. They are rich in protein, omega-3 fats, and vitamin D. Farmed salmon is available mainly in markets. In some cultures, such as the Nordic countries, it is considered the primary source of protein.
On the other hand, shrimp are saltwater animals. Like salmon, most shrimp in the market are farmed and not fished. Shrimp is the most popular and consumed seafood in the United States. However, Asian countries, like Japan and others, have the highest number of shrimp consumers. Shrimp is rich in omega-3 fats, calcium, and a good source of protein.
Both salmon and shrimp are classified as low-mercury seafood.
In this article, we will compare the nutritional content, the health impact, and the downsides of salmon and shrimp.
It is important to note that the salmon and shrimp consumption methods discussed in this article are in their cooked state. To preserve their nutritional value, we will discuss salmon in its grilled state and shrimp in its cooked (on medium heat) state.
Nutrition
Calories
Salmon is higher in calories compared to shrimp. Salmon contains 206 calories per 100g, while shrimp contains 119 calories per 100g.
Macronutrients
Salmon and shrimp are equally rich in protein. In addition to their protein content, they are highly rich in essential amino acids that are the building blocks of proteins (similar to non-essential amino acids). Essential amino acids must be consumed because the human body cannot synthesize them, contrary to non-essential amino acids.
Salmon has a higher fat content than shrimp, and it also has a higher content of monounsaturated and polyunsaturated fatty acids. However, it does not satisfy the daily recommended values.
Fat Type Comparison
Contains
more
Mono. FatMonounsaturated fat
+1058.2%
Contains
more
Poly. FatPolyunsaturated fat
+671.7%
Contains
less
Sat. FatSaturated fat
-78.3%
Salmon contains higher amounts of omega-3 fatty acids compared to shrimp.
It is important to note that salmon and shrimp are categorized as low-carbohydrate foods.
From the above, we can conclude that shrimp and salmon are protein-rich, low in carbohydrates, and have healthy amounts of monounsaturated and polyunsaturated fats. Salmon is more affluent in omega-3 fatty acids.
Macronutrient Comparison
Contains
more
FatsFats
+626.5%
Contains
more
CarbsCarbs
+∞%
Contains
more
WaterWater
+10.5%
Contains
more
OtherOther
+205%
Vitamins
Salmon is more affluent in vitamin B complex, specifically B1, B2, B3, B5, B6, B12, and D.
Shrimp are rich in vitamin E. Shrimp also contain vitamin B complex, mostly B12. However, their amount is less than the content of vitamin B12 present in salmon.
Vitamin Comparison
Contains
more
Vitamin CVitamin C
+∞%
Contains
more
Vitamin DVitamin D
+13000%
Contains
more
Vitamin B1Vitamin B1
+962.5%
Contains
more
Vitamin B2Vitamin B2
+462.5%
Contains
more
Vitamin B3Vitamin B3
+200.4%
Contains
more
Vitamin B5Vitamin B5
+184.2%
Contains
more
Vitamin B6Vitamin B6
+167.4%
Contains
more
Vitamin B12Vitamin B12
+68.7%
Contains
more
FolateFolate
+41.7%
Contains
more
Vitamin AVitamin A
+30.4%
Contains
more
Vitamin EVitamin E
+93%
Contains
more
Vitamin KVitamin K
+300%
Minerals
Salmon is richer in potassium. Meanwhile, shrimp is richer in selenium, choline, phosphorus, zinc, calcium, magnesium, and copper.
Noting that shrimps are higher in sodium.
Mineral Comparison
Contains
more
PotassiumPotassium
+125.9%
Contains
less
SodiumSodium
-93.6%
Contains
more
MagnesiumMagnesium
+23.3%
Contains
more
CalciumCalcium
+506.7%
Contains
more
CopperCopper
+426.5%
Contains
more
ZincZinc
+279.1%
Contains
more
PhosphorusPhosphorus
+21.4%
Contains
more
ManganeseManganese
+206.3%
Contains
more
SeleniumSelenium
+19.6%
Health Impact
Cardiovascular Health
Salmon and shrimp are rich sources of long-chain ω-3 fatty acids, which are beneficial for heart health. Moderate consumption of ω-3 fatty acids, such as docosahexaenoic acid (DHA) and eicosapentaenoic acid (EPA), may significantly decrease the risk of unstable angina, myocardial infarction, and sudden cardiac death (1, 2).
A combined analysis of 4 cohort studies suggests that consuming at least 175 grams of fish or seafood per week may reduce the risk of major cardiovascular disease and mortality in patients with prior cardiovascular disease (CVD). However, this benefit is not observed in the general population (3).
According to the National Institutes of Health, it is recommended to have a daily intake of 1.1-1.6 grams of omega-3 fatty acids. The American Heart Association suggests consuming two servings of fish or seafood (such as shrimp) per week, each weighing 3-4 ounces, to maintain a healthy diet (4).
To obtain 1.5 grams of omega-3 fatty acids, one would need to eat about 2-3 ounces of Atlantic salmon. Fish oil supplements contain around 300 milligrams of omega-3 fatty acids per pill, though doses may vary (4).
According to another source, it is recommended to have a diet containing approximately 500 mg/d of eicosapentaenoic acid (EPA) and docosahexaenoic acid (DHA), which can be achieved by having two fish meals per week, to reduce the risk of cardiovascular disease. For those who already have cardiovascular disease, it is recommended to take 1 g/d of omega-3 PUFAs (5).
It should be noted that combining statins, such as Atorvastatin and Rosuvastatin, with omega-3 fats is a safe and effective treatment for dyslipidemia. This combination may also benefit patients who recently suffered from a heart attack.
However, some recent randomized clinical trials have raised questions regarding the cardiovascular benefits of fish oil. This has made it difficult for healthcare providers to recommend omega-3 PUFA supplementation in accordance with clinical guidelines. Therefore, more studies are needed to provide more accurate information on the benefits of omega-3 PUFAs (2, 6).
The consumption of salmon and shrimp in moderate amounts has many other health impacts.
In children, the consumption of salmon and shrimp ensures the development of the child’s integrative nervous system. These nerves link the sensory and motor systems together. In addition to the integrative nervous system, salmon and shrimp also contribute to the development of the neural links formed in the brain tissues responsible for cognition and processing. (7) (8)
It is also observed that the consumption of lean salmon has decreased the risk of developing diabetes. (9)
The high amounts of omega-3 fatty acids in salmon have their benefits on the brain. Studies concluded that the consumption of salmon decreases cognitive decline in older people, keeping them aware and cognitive with healthy memory in older ages. (10)
Downsides
There are downsides to both salmon and shrimp from various perspectives.
Salmon and shrimp raised in farms might have antibiotics added to their ponds to control bacterial growth. Mostly, when grown on farms that are not qualified by the government or any other agricultural supervision, they would contain above-threshold amounts of antibiotics. As consumers, one should be selective of the farms or the suppliers that provide the salmon or shrimp to overcome this issue.
Another aspect is the religious approach. When it comes to kosher food, shrimp is classified as non-kosher, meaning that Jewish people cannot consume them. On the other hand, salmon is considered kosher and can be consumed by the Jewish community.
When it comes to consuming salmon, some cuisines consume salmon in its raw state. Raw salmon is very common in Japanese cuisine. However, it is essential to note that healthcare professionals usually recommend refraining from consuming raw animal meat. Raw salmon, if not appropriately treated, may harbor various types of foodborne infections. A common parasite that harbors salmon is the Diphyllobothrium Latium, a fish tapeworm that causes vitamin B12 deficiency in humans.
Salmon is cured and aged in some countries with salt to preserve it throughout winter. Cured salmon is also considered a delicacy in some cuisines. However, patients who suffer from health problems related to high sodium must be careful when consuming this kind of salmon.
Pollution is a significant factor in wild shrimp. If the sea is polluted from the zone where the shrimp are fished, it might cause serious health problems. So, one must always be careful of the suppliers that provide shrimp.
References
- https://pubmed.ncbi.nlm.nih.gov/30041496/
- https://pubmed.ncbi.nlm.nih.gov/25278765/
- https://jamanetwork.com/journals/jamainternalmedicine/fullarticle/2777338
- https://www.heart.org/en/news/2022/06/01/consuming
- https://pubmed.ncbi.nlm.nih.gov/16841863/
- https://pubmed.ncbi.nlm.nih.gov/22968891/
- https://academic.oup.com/ajcn/article/89/2/678S/4596785
- https://doi.org/10.1016/j.plefa.2010.02.007
- https://care.diabetesjournals.org/content/32/10/1857
- https://www.ncbi.nlm.nih.gov/pmc/articles/PMC2805706/

Infographic
All nutrients comparison - raw data values
| Nutrient | |
|
DV% diff. |
| Vitamin D* | 526 IU | 4 IU | 65% |
| Vitamin D | 13.1µg | 0.1µg | 65% |
| Cholesterol | 63mg | 211mg | 49% |
| Vitamin B12 | 2.8µg | 1.66µg | 48% |
| Sodium | 61mg | 947mg | 39% |
| Vitamin B3 | 8.045mg | 2.678mg | 34% |
| Vitamin B6 | 0.647mg | 0.242mg | 31% |
| Vitamin B1 | 0.34mg | 0.032mg | 26% |
| Polyunsaturated fat | 4.553g | 0.59g | 26% |
| Copper | 0.049mg | 0.258mg | 23% |
| Vitamin B5 | 1.475mg | 0.519mg | 19% |
| Fats | 12.35g | 1.7g | 16% |
| Selenium | 41.4µg | 49.5µg | 15% |
| Zinc | 0.43mg | 1.63mg | 11% |
| Monounsaturated fat | 4.181g | 0.361g | 10% |
| Vitamin B2 | 0.135mg | 0.024mg | 9% |
| Saturated fat | 2.397g | 0.521g | 9% |
| Calcium | 15mg | 91mg | 8% |
| Phosphorus | 252mg | 306mg | 8% |
| Choline | 90.5mg | 135.4mg | 8% |
| Vitamin E | 1.14mg | 2.2mg | 7% |
| Potassium | 384mg | 170mg | 6% |
| Calories | 206kcal | 119kcal | 4% |
| Vitamin C | 3.7mg | 0mg | 4% |
| Folate | 34µg | 24µg | 3% |
| Magnesium | 30mg | 37mg | 2% |
| Vitamin A | 69µg | 90µg | 2% |
| Protein | 22.1g | 22.78g | 1% |
| Carbs | 0g | 1.52g | 1% |
| Manganese | 0.016mg | 0.049mg | 1% |
| Protein per 100 calories | 11g | 19g | N/A |
| Calories per 10 g protein | 93kcal | 52kcal | N/A |
| Weight per 100 calories | 49g | 84g | N/A |
| Unsaturated / Saturated Fat ratio | 3.6 | 1.8 | N/A |
| Net carbs | 0g | 1.52g | N/A |
| Iron | 0.34mg | 0.32mg | 0% |
| Vitamin K | 0.1µg | 0.4µg | 0% |
| Trans fat | 0.035g | N/A | |
| Tryptophan | 0.248mg | 0.26mg | 0% |
| Threonine | 0.969mg | 0.904mg | 0% |
| Isoleucine | 1.018mg | 1.05mg | 0% |
| Leucine | 1.796mg | 1.95mg | 0% |
| Lysine | 2.03mg | 2.172mg | 0% |
| Methionine | 0.654mg | 0.665mg | 0% |
| Phenylalanine | 0.863mg | 0.992mg | 0% |
| Valine | 1.139mg | 1.067mg | 0% |
| Histidine | 0.651mg | 0.501mg | 0% |
| Omega-3 - EPA | 0.69g | 0.135g | N/A |
| Omega-3 - DHA | 1.457g | 0.141g | N/A |
| Omega-3 - DPA | 0.17g | 0.012g | N/A |
| Omega-6 - Eicosadienoic acid | 0.012g | N/A |
People also compare


References
All the values for which the sources are not specified explicitly are taken from FDA’s Food Central. The exact link to the food presented on this page can be found below.
- Salmon - https://fdc.nal.usda.gov/fdc-app.html#/food-details/175168/nutrients
- Shrimp - https://fdc.nal.usda.gov/fdc-app.html#/food-details/171971/nutrients
All the Daily Values are presented for males aged 31-50, for 2000-calorie diets.