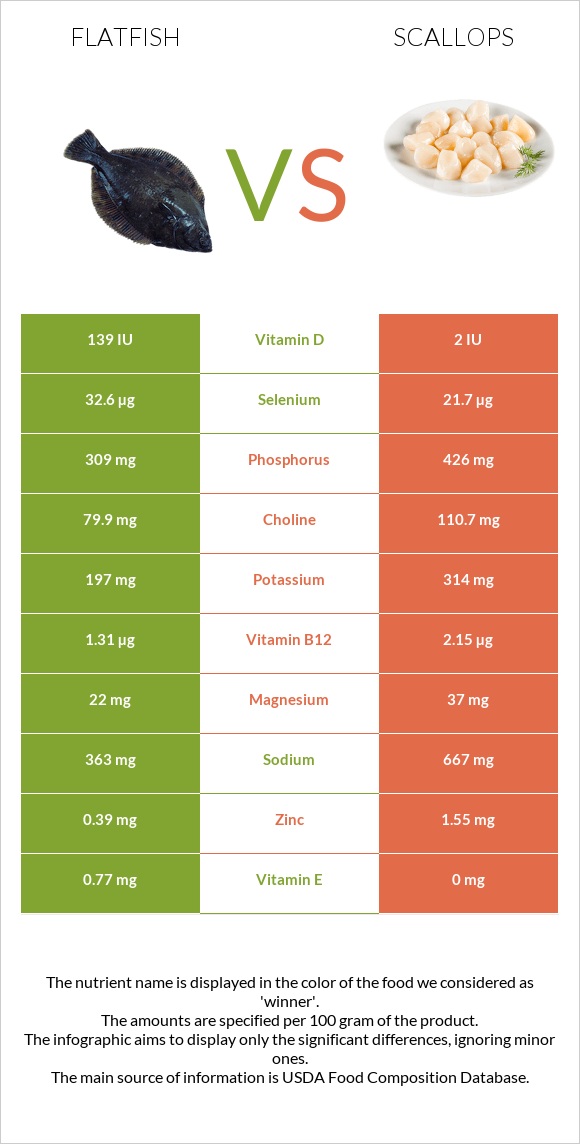
How are flatfish and scallops different? Flatfish is higher in selenium, vitamin D* and vitamin E; however, scallops are richer in vitamin B12, phosphorus, zinc, and choline. Daily need coverage for vitamin B12 for scallops is 35% higher. Flatfish has less sodium. Fish, flatfish (flounder and sole species), cooked, dry heat and Mollusks, scallop, (bay and sea), cooked, steamed are the varieties used in this article.
Infographic
Mineral Comparison
Mineral comparison score is based on the number of minerals by which one or the other food is richer. The "coverage" charts below show how much of the daily needs can be covered by 300 grams of the food.
3
100 g
300 g
3 oz - 85g 1 fillet - 127g
Magnesium
Magnesium
Calcium
Calcium
Potassium
Potassium
Iron
Iron
Copper
Copper
Zinc
Zinc
Phosphorus
Phosphorus
Sodium
Sodium
Manganese
Manganese
Selenium
Selenium
16%
7.5%
17%
8.6%
7.7%
11%
132%
47%
2.2%
178%
7
100 g
300 g
3 oz - 85g
Magnesium
Magnesium
Calcium
Calcium
Potassium
Potassium
Iron
Iron
Copper
Copper
Zinc
Zinc
Phosphorus
Phosphorus
Sodium
Sodium
Manganese
Manganese
Selenium
Selenium
26%
3%
28%
22%
11%
42%
183%
87%
3.8%
118%
Vitamin Comparison
Vitamin comparison score is based on the number of vitamins by which one or the other food is richer. The "coverage" charts below show how much of the daily needs can be covered by 300 grams of the food.
6
100 g
300 g
3 oz - 85g 1 fillet - 127g
Vitamin C
Vit. C
Vitamin D
Vit. D
Vitamin A
Vit. A
Vitamin E
Vit. E
Vitamin B1
Vit. B1
Vitamin B2
Vit. B2
Vitamin B3
Vit. B3
Vitamin B5
Vit. B5
Vitamin B6
Vit. B6
Vitamin B12
Vit. B12
Vitamin K
Vit. K
Folate
Folate
0%
53%
4%
15%
6.5%
5.8%
24%
14%
27%
164%
0.25%
4.5%
3
100 g
300 g
3 oz - 85g
Vitamin C
Vit. C
Vitamin D
Vit. D
Vitamin A
Vit. A
Vitamin E
Vit. E
Vitamin B1
Vit. B1
Vitamin B2
Vit. B2
Vitamin B3
Vit. B3
Vitamin B5
Vit. B5
Vitamin B6
Vit. B6
Vitamin B12
Vit. B12
Vitamin K
Vit. K
Folate
Folate
0%
0%
0.67%
0%
3%
5.5%
20%
22%
26%
269%
0%
15%
All nutrients comparison - raw data values
Nutrient
DV% diff.
Vitamin B12
1.31µg
2.15µg
35%
Selenium
32.6µg
21.7µg
20%
Vitamin D
3.5µg
0µg
18%
Vitamin D*
139 IU
2 IU
17%
Phosphorus
309mg
426mg
17%
Sodium
363mg
667mg
13%
Protein
15.24g
20.54g
11%
Zinc
0.39mg
1.55mg
11%
Choline
79.9mg
110.7mg
6%
Cholesterol
56mg
41mg
5%
Vitamin E
0.77mg
0mg
5%
Magnesium
22mg
37mg
4%
Iron
0.23mg
0.58mg
4%
Folate
6µg
20µg
4%
Potassium
197mg
314mg
3%
Vitamin B5
0.227mg
0.366mg
3%
Fats
2.37g
0.84g
2%
Carbs
0g
5.41g
2%
Calcium
25mg
10mg
2%
Starch
0g
3.69g
2%
Polyunsaturated fat
0.459g
0.222g
2%
Calories
86kcal
111kcal
1%
Copper
0.023mg
0.033mg
1%
Vitamin A
12µg
2µg
1%
Manganese
0.017mg
0.029mg
1%
Vitamin B1
0.026mg
0.012mg
1%
Vitamin B3
1.278mg
1.076mg
1%
Saturated fat
0.542g
0.218g
1%
Monounsaturated fat
0.657g
0.082g
1%
Protein per 100 calories
18g
19g
N/A
Calories per 10 g protein
56kcal
54kcal
N/A
Weight per 100 calories
116g
90g
N/A
Unsaturated / Saturated Fat ratio
2.1
1.4
N/A
Net carbs
0g
5.41g
N/A
Vitamin B2
0.025mg
0.024mg
0%
Vitamin B6
0.115mg
0.112mg
0%
Vitamin K
0.1µg
0µg
0%
Trans fat
0.014g
0.009g
N/A
Tryptophan
0.197mg
0.173mg
0%
Threonine
0.719mg
0.629mg
0%
Isoleucine
0.754mg
0.692mg
0%
Leucine
1.335mg
1.226mg
0%
Lysine
1.561mg
1.258mg
0%
Methionine
0.56mg
0.487mg
0%
Phenylalanine
0.624mg
0.597mg
0%
Valine
0.8mg
0.645mg
0%
Histidine
0.374mg
0.314mg
0%
Omega-3 - EPA
0.168g
0.072g
N/A
Omega-3 - DHA
0.132g
0.104g
N/A
Omega-3 - DPA
0.034g
0.005g
N/A
Omega-6 - Eicosadienoic acid
0.006g
0.002g
N/A
Macronutrient Comparison
Macronutrient breakdown side-by-side comparison
2
15%
2%
81%
Protein:
15.24 g
Fats:
2.37 g
Carbs:
0 g
Water:
81.11 g
Other:
1.28 g
3
21%
5%
70%
3%
Protein:
20.54 g
Fats:
0.84 g
Carbs:
5.41 g
Water:
70.25 g
Other:
2.96 g
Contains
more
Fats Fats
+182.1%
Contains
more
Water Water
+15.5%
Contains
more
Protein Protein
+34.8%
Contains
more
Carbs Carbs
+∞%
Contains
more
Other Other
+131.3%
Fat Type Comparison
Fat type breakdown side-by-side comparison
2
33%
40%
28%
Saturated fat:
Sat. Fat
0.542 g
Monounsaturated fat:
Mono. Fat
0.657 g
Polyunsaturated fat:
Poly. Fat
0.459 g
1
42%
16%
43%
Saturated fat:
Sat. Fat
0.218 g
Monounsaturated fat:
Mono. Fat
0.082 g
Polyunsaturated fat:
Poly. Fat
0.222 g
Contains
more
Mono. Fat Monounsaturated fat
+701.2%
Contains
more
Poly. Fat Polyunsaturated fat
+106.8%
Contains
less
Sat. Fat Saturated fat
-59.8%