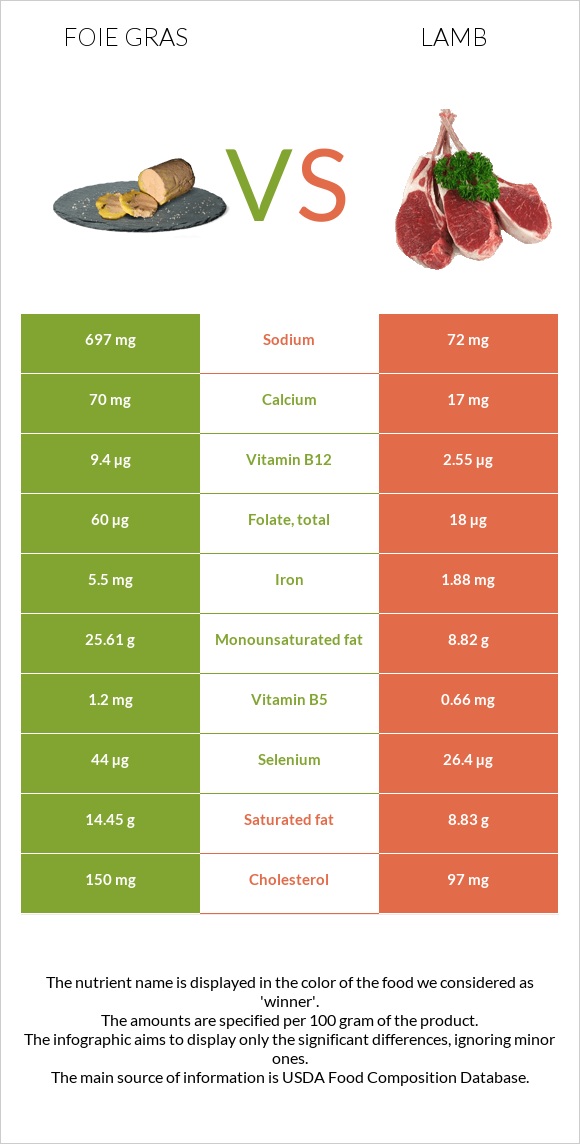
The main differences between foie gras and lamb Foie gras has more vitamin B12, vitamin A, iron, selenium, and copper; however, lamb has more zinc and vitamin B3. Daily need coverage for vitamin B12 for foie gras is 285% higher. Lamb is lower in sodium. Food types used in this article are Pate de foie gras, canned (goose liver pate), smoked and Lamb, domestic, composite of trimmed retail cuts, separable lean, and fat, trimmed to 1/4" fat, choice, cooked .
Infographic
Mineral Comparison
Mineral comparison score is based on the number of minerals by which one or the other food is richer. The "coverage" charts below show how much of the daily needs can be covered by 300 grams of the food.
5
100 g
300 g
1 tbsp - 13g 1 oz - 28.35g
Magnesium
Magnesium
Calcium
Calcium
Potassium
Potassium
Iron
Iron
Copper
Copper
Zinc
Zinc
Phosphorus
Phosphorus
Sodium
Sodium
Manganese
Manganese
Selenium
Selenium
9.3%
21%
12%
206%
133%
25%
86%
91%
16%
240%
4
100 g
300 g
3 oz - 85g 1 piece, cooked, excluding refuse (yield from 1 lb raw meat with refuse) - 242g
Magnesium
Magnesium
Calcium
Calcium
Potassium
Potassium
Iron
Iron
Copper
Copper
Zinc
Zinc
Phosphorus
Phosphorus
Sodium
Sodium
Manganese
Manganese
Selenium
Selenium
16%
5.1%
27%
71%
40%
122%
81%
9.4%
2.9%
144%
Vitamin Comparison
Vitamin comparison score is based on the number of vitamins by which one or the other food is richer. The "coverage" charts below show how much of the daily needs can be covered by 300 grams of the food.
6
100 g
300 g
1 tbsp - 13g 1 oz - 28.35g
Vitamin C
Vit. C
Vitamin D
Vit. D
Vitamin A
Vit. A
Vitamin E
Vit. E
Vitamin B1
Vit. B1
Vitamin B2
Vit. B2
Vitamin B3
Vit. B3
Vitamin B5
Vit. B5
Vitamin B6
Vit. B6
Vitamin B12
Vit. B12
Vitamin K
Vit. K
Folate
Folate
6.7%
0%
334%
0%
22%
69%
47%
72%
14%
1175%
0%
45%
6
100 g
300 g
3 oz - 85g 1 piece, cooked, excluding refuse (yield from 1 lb raw meat with refuse) - 242g
Vitamin C
Vit. C
Vitamin D
Vit. D
Vitamin A
Vit. A
Vitamin E
Vit. E
Vitamin B1
Vit. B1
Vitamin B2
Vit. B2
Vitamin B3
Vit. B3
Vitamin B5
Vit. B5
Vitamin B6
Vit. B6
Vitamin B12
Vit. B12
Vitamin K
Vit. K
Folate
Folate
0%
1.5%
0%
2.8%
25%
58%
125%
40%
30%
319%
12%
14%
All nutrients comparison - raw data values
Nutrient
DV% diff.
Vitamin B12
9.4µg
2.55µg
285%
Vitamin A
1001µg
0µg
111%
Iron
5.5mg
1.88mg
45%
Monounsaturated fat
25.61g
8.82g
42%
Fats
43.84g
20.94g
35%
Zinc
0.92mg
4.46mg
32%
Selenium
44µg
26.4µg
32%
Copper
0.4mg
0.119mg
31%
Sodium
697mg
72mg
27%
Protein
11.4g
24.52g
26%
Vitamin B3
2.51mg
6.66mg
26%
Saturated fat
14.45g
8.83g
26%
Cholesterol
150mg
97mg
18%
Choline
93.7mg
17%
Vitamin B5
1.2mg
0.66mg
11%
Folate
60µg
18µg
11%
Calories
462kcal
294kcal
8%
Calcium
70mg
17mg
5%
Potassium
138mg
310mg
5%
Vitamin B6
0.06mg
0.13mg
5%
Manganese
0.12mg
0.022mg
4%
Vitamin B2
0.299mg
0.25mg
4%
Vitamin K
4.6µg
4%
Polyunsaturated fat
0.84g
1.51g
4%
Vitamin C
2mg
0mg
2%
Carbs
4.67g
0g
2%
Magnesium
13mg
23mg
2%
Phosphorus
200mg
188mg
2%
Vitamin D
0.1µg
1%
Vitamin E
0.14mg
1%
Vitamin B1
0.088mg
0.1mg
1%
Protein per 100 calories
2.5g
8.3g
N/A
Calories per 10 g protein
405kcal
120kcal
N/A
Weight per 100 calories
22g
34g
N/A
Unsaturated / Saturated Fat ratio
1.8
1.2
N/A
Net carbs
4.67g
0g
N/A
Vitamin D*
2 IU
0%
Tryptophan
0.161mg
0.287mg
0%
Threonine
0.507mg
1.05mg
0%
Isoleucine
0.606mg
1.183mg
0%
Leucine
1.029mg
1.908mg
0%
Lysine
0.863mg
2.166mg
0%
Methionine
0.27mg
0.629mg
0%
Phenylalanine
0.567mg
0.998mg
0%
Valine
0.719mg
1.323mg
0%
Histidine
0.303mg
0.777mg
0%
Macronutrient Comparison
Macronutrient breakdown side-by-side comparison
3
11%
44%
5%
37%
3%
Protein:
11.4 g
Fats:
43.84 g
Carbs:
4.67 g
Water:
37.04 g
Other:
3.05 g
2
25%
21%
54%
Protein:
24.52 g
Fats:
20.94 g
Carbs:
0 g
Water:
53.72 g
Other:
0.82 g
Contains
more
Fats Fats
+109.4%
Contains
more
Carbs Carbs
+∞%
Contains
more
Other Other
+272%
Contains
more
Protein Protein
+115.1%
Contains
more
Water Water
+45%
Fat Type Comparison
Fat type breakdown side-by-side comparison
1
35%
63%
2%
Saturated fat:
Sat. Fat
14.45 g
Monounsaturated fat:
Mono. Fat
25.61 g
Polyunsaturated fat:
Poly. Fat
0.84 g
2
46%
46%
8%
Saturated fat:
Sat. Fat
8.83 g
Monounsaturated fat:
Mono. Fat
8.82 g
Polyunsaturated fat:
Poly. Fat
1.51 g
Contains
more
Mono. Fat Monounsaturated fat
+190.4%
Contains
less
Sat. Fat Saturated fat
-38.9%
Contains
more
Poly. Fat Polyunsaturated fat
+79.8%